


 42 / 213

Reducing Food Waste
In tFo 01CMember Countries
COMCEC
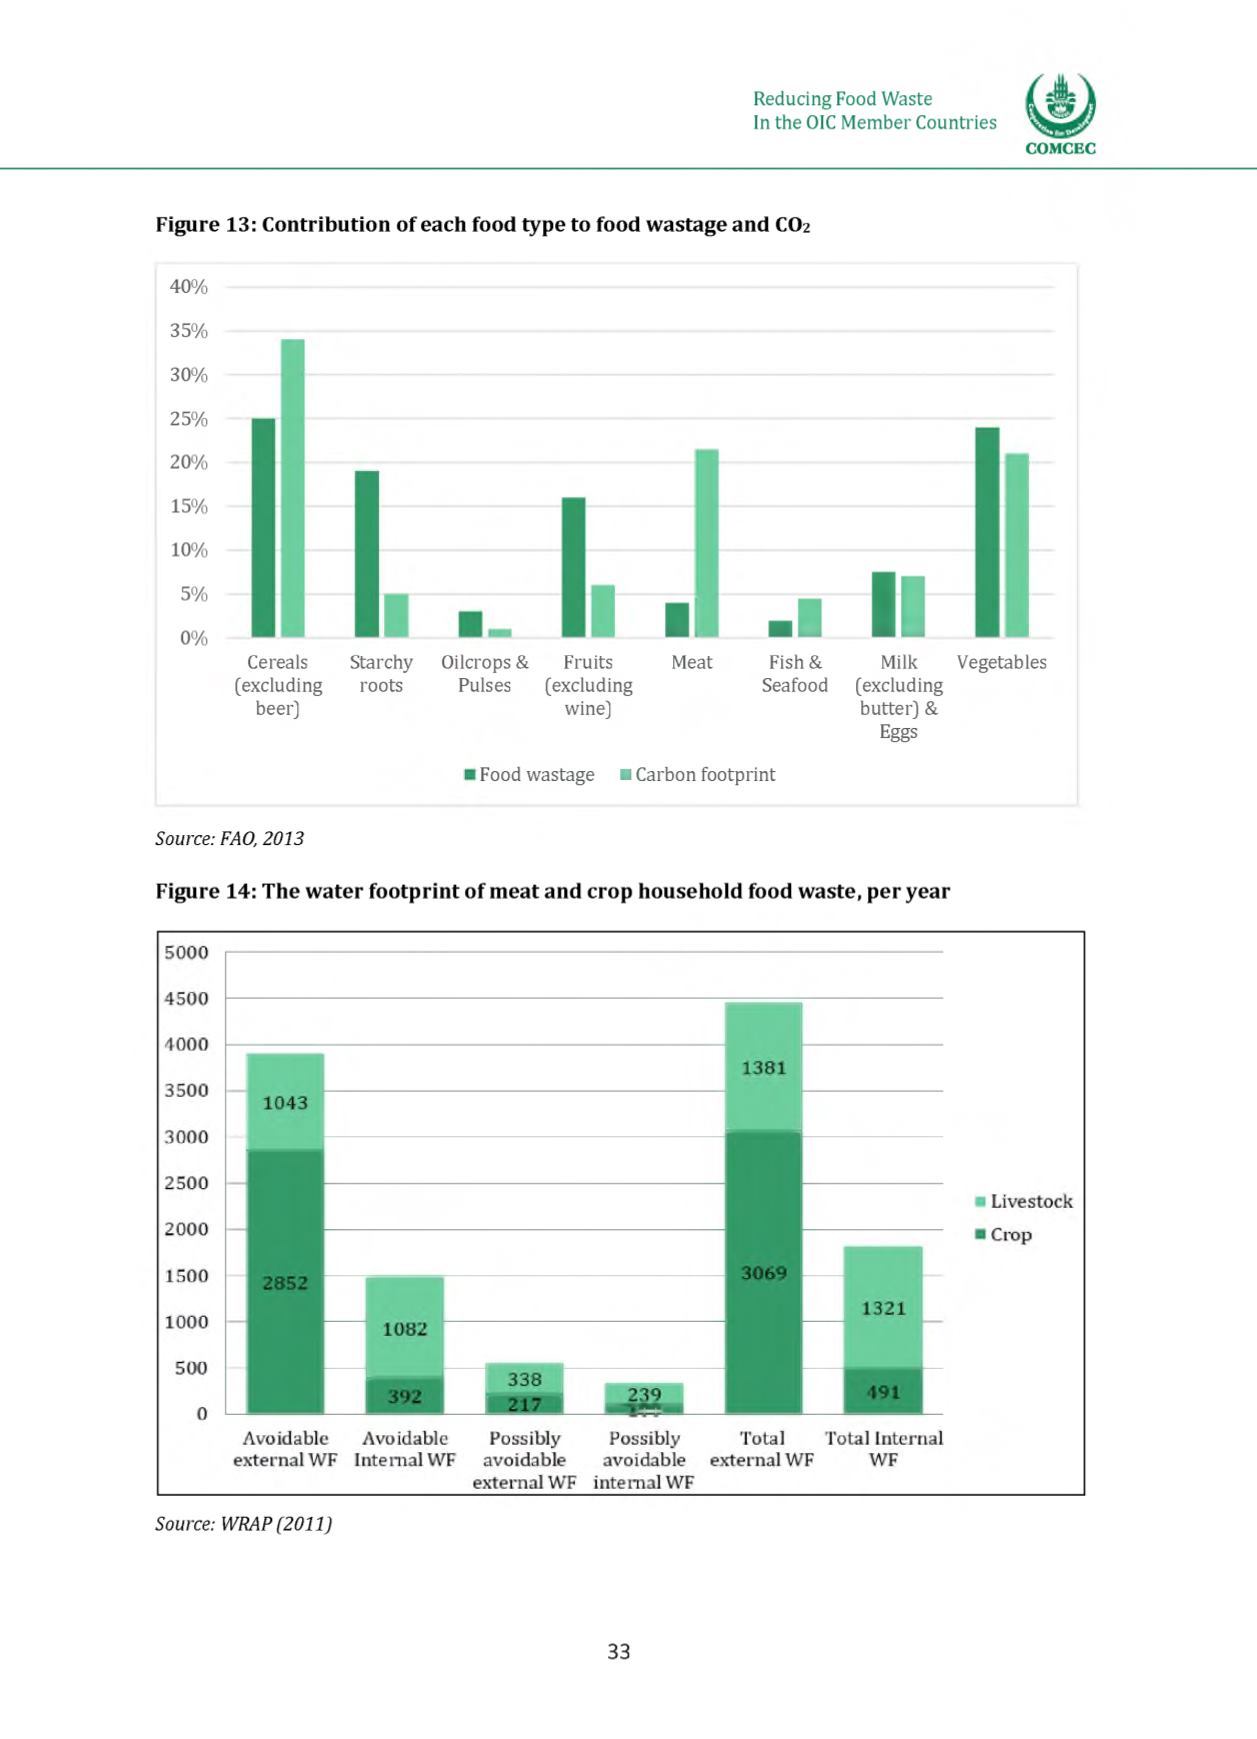
Figure 13: Contribution of each food type to food wastage and CO
2
40% ------------------------------------------------------
35%
30%
25%
20%
15%
10%
5%
0%
Cereals
(excluding
beer)
Starchy Oilcrops &
roots
Pulses
Fruits
(excluding
wine)
■I
Meat
. 1
I I
Fish & Milk
Seafood (excluding
butter) &
Eggs
Vegetables
Food wastage ■Carbon footprint
Source: FAO, 2013
Figure 14: The water footprint of meat and crop household food waste, per year
Source: WRAP (2011)
33