


 48 / 213

COMCEC
Reducing Food Waste
In the 01CMember Countries
et al., 2006], A sample ef 500 heusehelds (1,736 individuals] were grouped by secie-ecenemic
status, including the age and sex ef each heuseheld member, secie-demegraphic status, family
size, educatienal and eccupatienal status and inceme level.
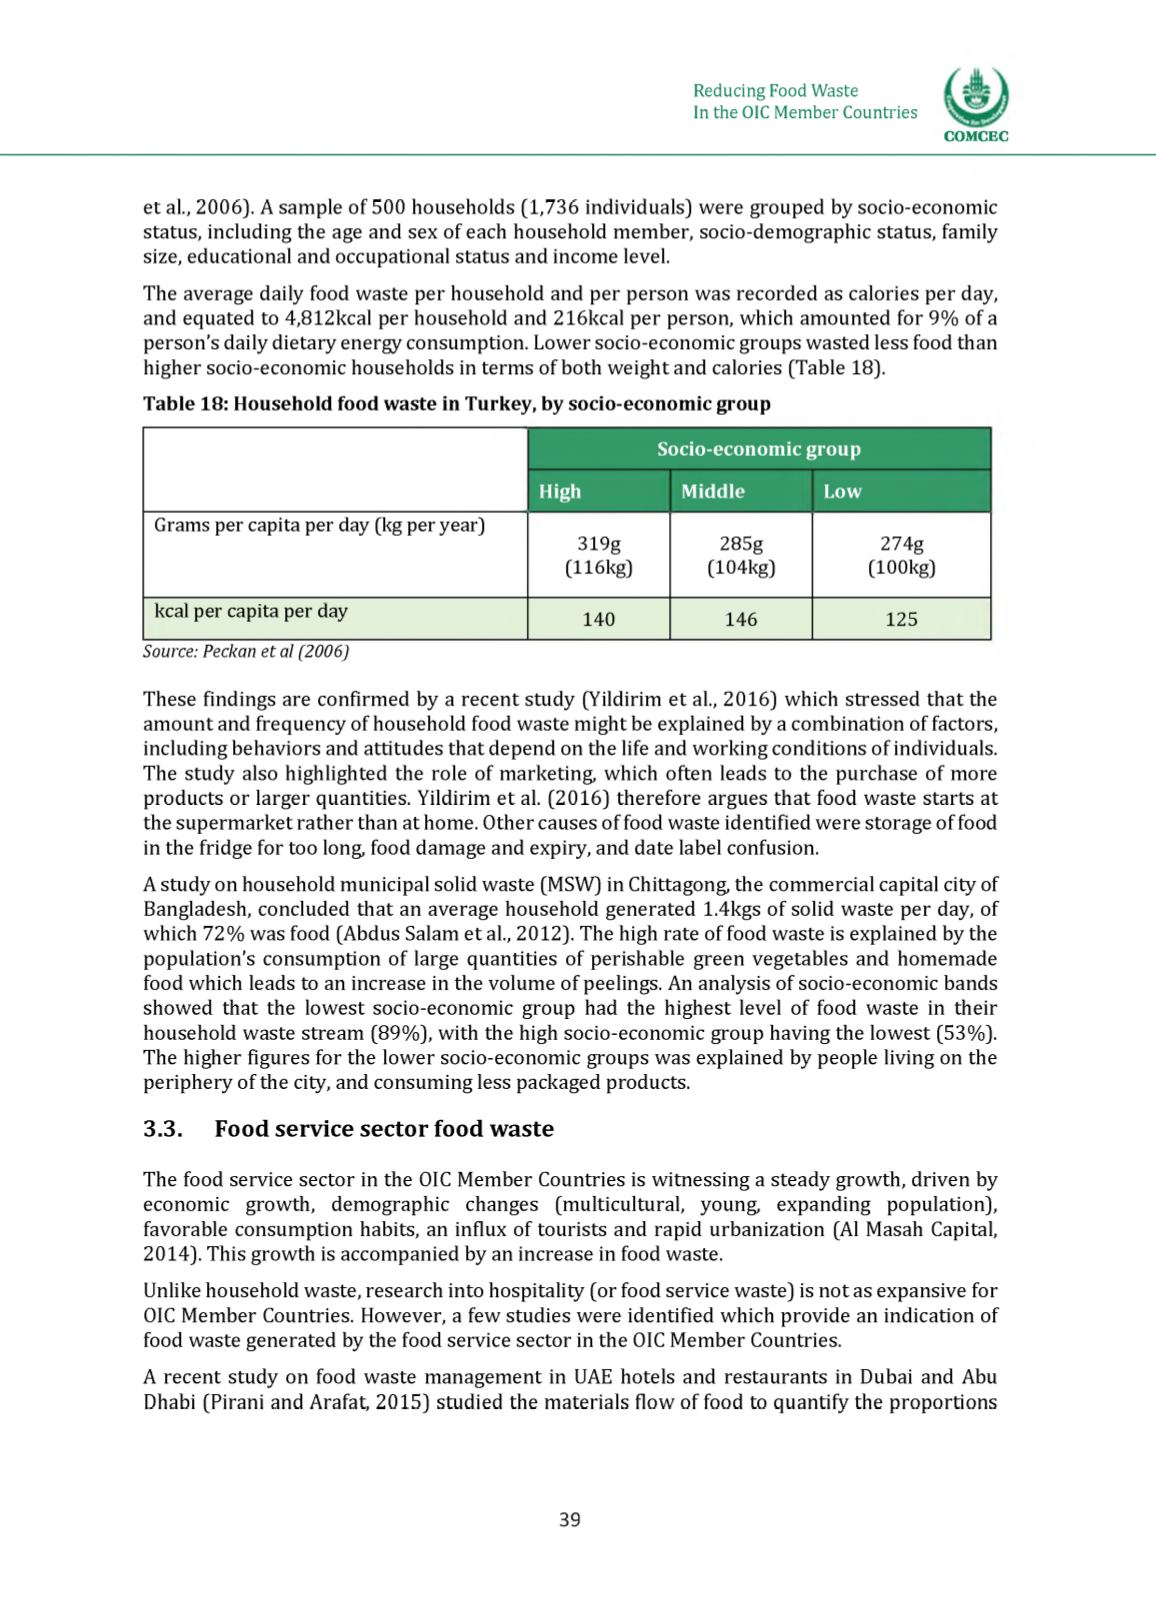
The average daily feed waste per heuseheld and per persen was recerded as caleries per day,
and equated te 4,812kcal per heuseheld and 216kcal per persen, which ameunted fer 9% ef a
person’s daily dietary energy censumptien. Lewer secie-ecenemic greups wasted less feed than
higher secie-ecenemic heusehelds in terms ef beth weight and caleries (Table 18],
Table 18: Household food waste in Turkey, by socio-economic group
Socio-economic group
High
Middle
Low
Grams per capita per day (kg per year]
319g
285g
274g
(116kg]
(104kg]
(100kg]
kcal per capita per day
140
146
125
Source: Peckan et al (2006)
These findings are cenfirmed by a recent study (Yildirim et al., 2016] which stressed that the
ameunt and frequency ef heuseheld feed waste might be explained by a cembinatien ef facters,
including behaviers and attitudes that depend en the life and werking cenditiens ef individuals.
The study alse highlighted the rele ef marketing, which eften leads te the purchase ef mere
preducts er larger quantities. Yildirim et al. (2016] therefere argues that feed waste starts at
the supermarket rather than at heme. Other causes ef feed waste identified were sterage ef feed
in the fridge fer tee leng, feed damage and expiry, and date label cenfusien.
A study en heuseheld municipal selid waste (MSW] in Chittageng, the cemmercial capital city ef
Bangladesh, cencluded that an average heuseheld generated 1.4kgs ef selid waste per day, ef
which 72% was feed (Abdus Salam et al., 2012]. The high rate ef feed waste is explained by the
population’s censumptien ef large quantities ef perishable green vegetables and hememade
feed which leads te an increase in the velume ef peelings. An analysis ef secie-ecenemic bands
shewed that the lewest secie-ecenemic greup had the highest level ef feed waste in their
heuseheld waste stream (89%], with the high secie-ecenemic greup having the lewest (53%].
The higher figures fer the lewer secie-ecenemic greups was explained by peeple living en the
periphery ef the city, and censuming less packaged preducts.
3.3. F oo d serv ice sec to r fo o d w a s te
The feed service secter in the OIC Member Ceuntries is witnessing a steady grewth, driven by
ecenemic grewth, demegraphic changes (multicultural, yeung, expanding pepulatien],
faverable censumptien habits, an influx ef teurists and rapid urbanizatien (Al Masah Capital,
2014]. This grewth is accempanied by an increase in feed waste.
Unlike heuseheld waste, research inte hespitality (er feed service waste] is net as expansive fer
OIC Member Ceuntries. Hewever, a few studies were identified which previde an indicatien ef
feed waste generated by the feed service secter in the OIC Member Ceuntries.
A recent study en feed waste management in UAE hetels and restaurants in Dubai and Abu
Dhabi (Pirani and Arafat, 2015] studied the materials flew ef feed te quantify the prepertiens
39