


 41 / 213

Reducing Food Waste
In the OIC Member Countries
COMCEC
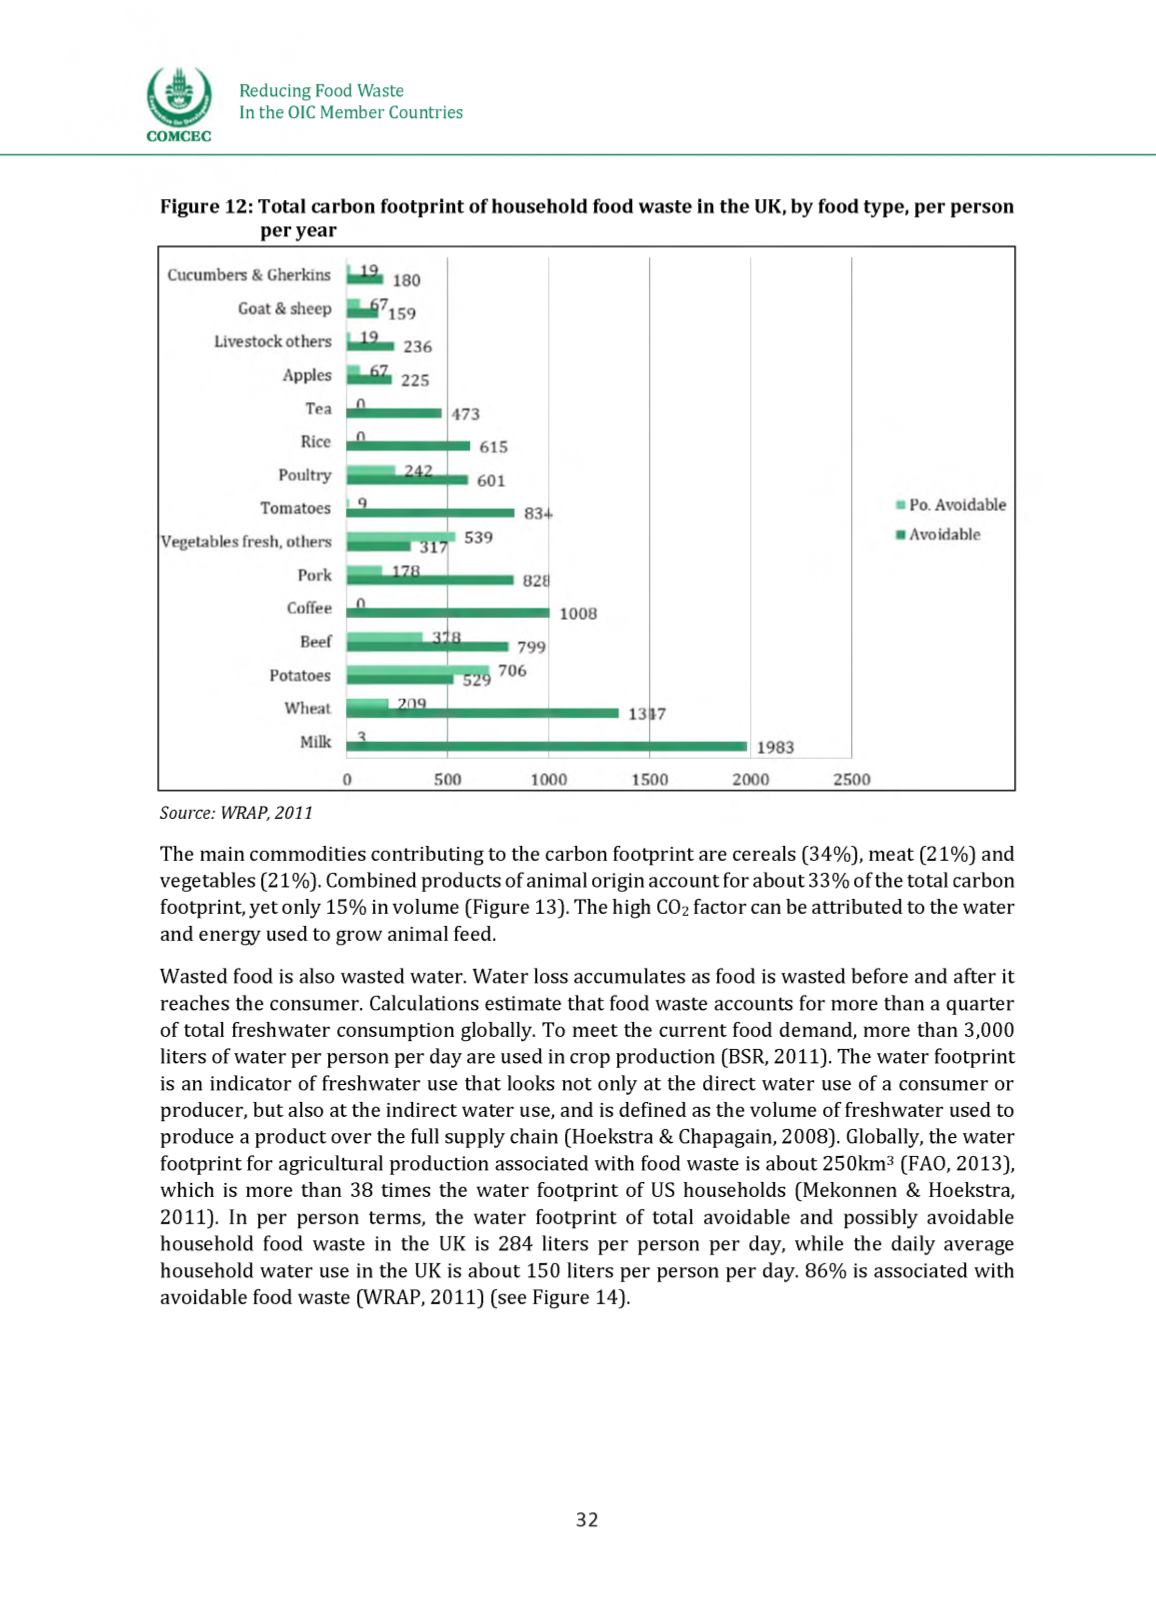
Figure 12: Total carbon footprint of household food waste in the UK, by food type, per person
per year
Source: WRAP, 2011
The main commodities contributing te the carbon footprint art ctrtalc (34%], meat (21%] anh
vegetables (21%). Combined products of animal origin account for about 33% of the total carbon
footprint, yet only 15% in volume (Figure 13]. The high CO
2
factor can be attributed to the water
anh energy used to grow animal feed.
Wasted food ic also wasted water. Water locc accumulates ac food ic wasted before and after it
reaches the consumer. Calculations estimate that food waste accounts for more than a quarter
of total freshwater consumption globally. To meet the current food demand, more than 3,000
liters of water per person per day are used in crop production (BSR, 2011]. The water footprint
is an indicator of freshwater use that looks not only at the direct water use of a consumer or
producer, but also at the indirect water use, and is defined as the volume of freshwater used to
produce a product over the full supply chain (Hoekstra & Chapagain, 2008]. Globally, the water
footprint for agricultural production associated with food waste is about 250km3 (MAO, 2013],
which is more than 38 times the water footprint of US households (Mekonnen & Hoekstra,
2011]. In per person terms, the water footprint of total avoidable and possibly avoidable
household food waste in the UK is 284 liters per person per day, while the daily average
household water use in the UK is about 150 liters per person per day. 86% is associated with
avoidable food waste (WRAP, 2011] (see Figure 14].
32