


 50 / 213

Reducing Food Waste
In the OIC Member Countries
COMCEC
Table 19: Average food waste generated per customer, by food preparation and consumption
stage
Food preparation and consumption
Breakfast
buffet
Lunch
A ¡a
carte
Lunch
buffet
Dinner
A ¡a
carte
Dinner
buffet
Per customer per day (g)
and per year (kg)
Preparation waste
600g
(219kg)
800g
(292kg)
600g
(219kg)
600g
(219kg)
500g
(183kg)
Customer plate leftover waste
300g
(110kg)
1,400g
(511kg)
100g
(37kg)
300g
(110kg)
400g
(146kg)
Buffet leftover waste
300g
(110kg)
NA
400g
(146kg)
NA
200g
(73kg)
Total waste per customer
1.2kg
(438kg)
2.2kg
(803kg)
11kg
(402kg)
1kg
(365kg)
1kg
(365kg)
Source: Papargyropoulou et al. (2016)
If the outlier of the lunch time
A la carte
service is excluded, the figures suggest that the buffet
services were more wasteful than the
A la carte
service, as they produced substantial amounts
of leftovers, making it a more wasteful type of service. This demonstrates how food wasted was
affected by the type of service provided and food consumption practices of the customer. The
same was found for the surveyed OIC Member Country food service establishments.
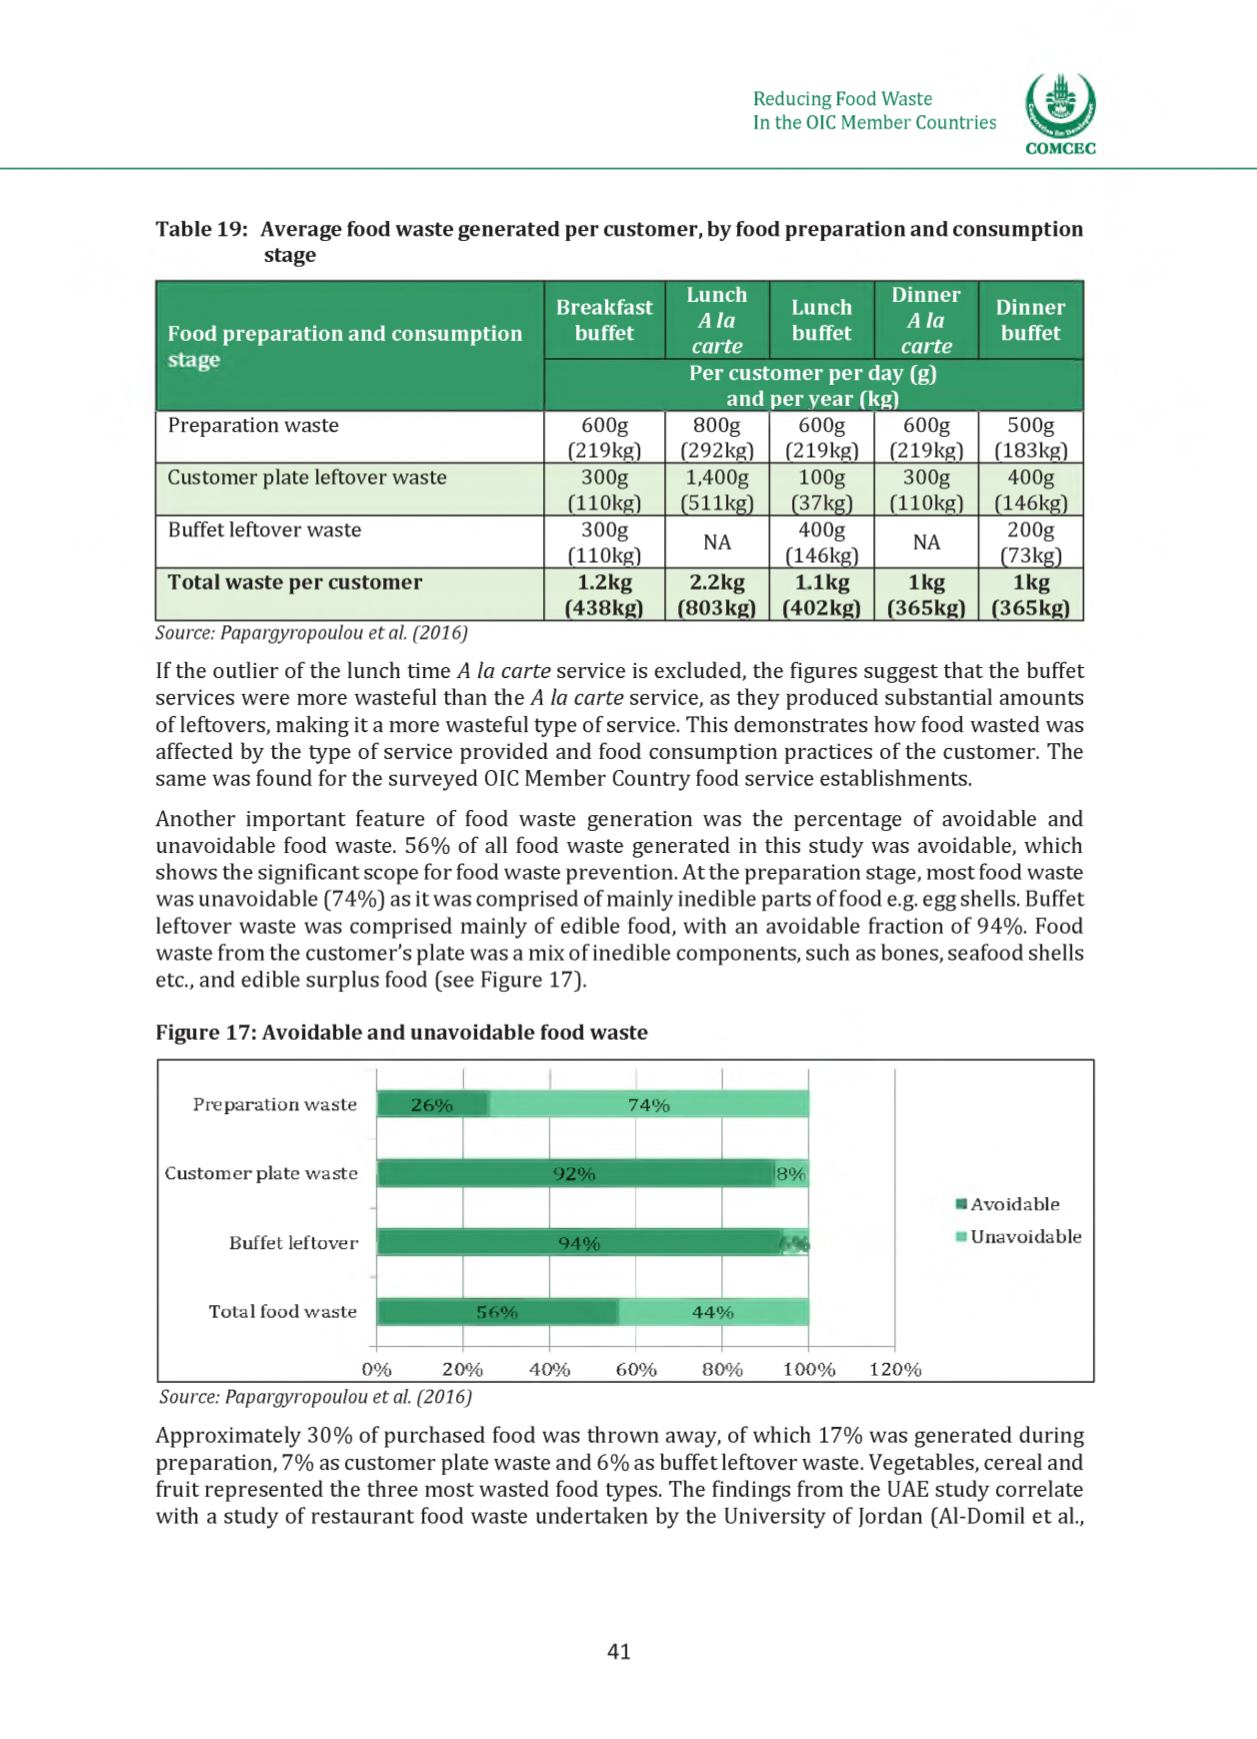
Another important feature of food waste generation was the percentage of avoidable and
unavoidable food waste. 56% of all food waste generated in this study was avoidable, which
shows the significant scope for food waste prevention. At the preparation stage, most food waste
was unavoidable (74%] as it was comprised of mainly inedible parts of food e.g. egg shells. Buffet
leftover waste was comprised mainly of edible food, with an avoidable fraction of 94%. Food
waste from the customer’s plate was a mix of inedible components, such as bones, seafood shells
etc., and edible surplus food (see Figure 17].
Figure 17: Avoidable and unavoidable food waste
Preparation wa ste
Customer plate waste
Buffet leftover
Total food waste
26%
74%
92%
8%
94%
N
56%
44%
I Avoidable
Unavoidable
0%
20%
40%
60%
80%
100%
120%
Source: Papargyropoulou et al. (2016)
Approximately 30% of purchased food was thrown away, of which 17% was generated during
preparation, 7% as customer plate waste and 6% as buffet leftover waste. Vegetables, cereal and
fruit represented the three most wasted food types. The findings from the UAE study correlate
with a study of restaurant food waste undertaken by the University of Jordan (Al-Domil et al.,
41