


 126 / 272

Reviewing Agricultural Trade Policies
To Promote Intra-OIC Agricultural Trade
114
Figure 4.33 shows exports of agricultural raw materials of The Gambia. The graphs reveal that
there has been relatively insignificant trade volume over the years, except for 2016 where there
is a sharp increase in exports of agricultural raw materials to the African group.
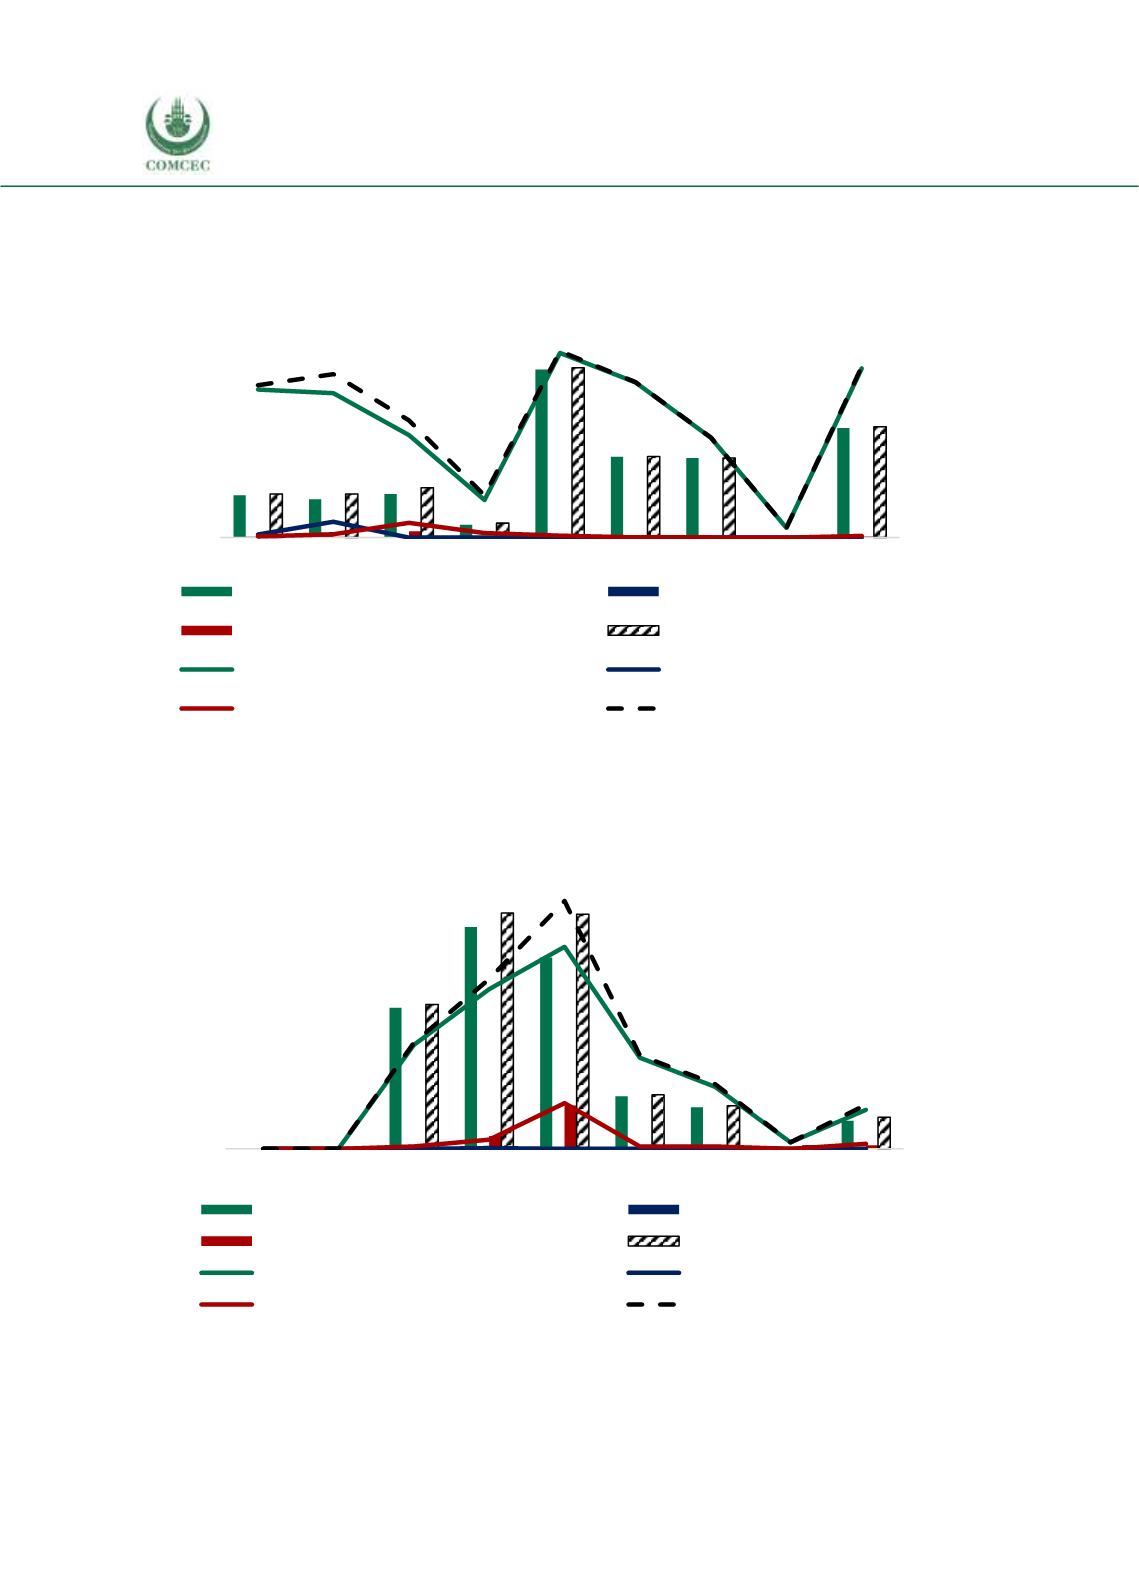
Figure 4. 34 Imports of Gambia’s Agricultural Raw Materials from the OIC Groups
Source: CEPII BACI, Eurostat RAMON, UN Comtrade, UN Trade Statistics, and authors’ calculations
As seen in Figure 4.34, In agricultural raw material imports, African group is yet again the top
trade partner, with fluctuating shares across the years.
Figure 4. 35 Exports of Gambia’s Fish Products to the OIC Groups
Source: CEPII BACI, Eurostat RAMON, UN Comtrade, UN Trade Statistics, and authors’ calculations
Fish is another important export and import item for the Gambia. Figure 4.35 demonstrates that
African group is the top export partner for The Gambian fish trade, although with fluctuating
0
400
800
1.200
1.600
2.000
0
20
40
60
80
100
2008 2009 2010 2011 2012 2013 2014 2015 2016
African Group (1000 $)
Asian Group (1000 $)
Arab Group (1000 $)
OIC Total (1000 $)
African share in total agri-raw imp. (%)
Asian share in total agri-raw imp. (%)
Arab share in total agri-raw imp. (%)
OIC share in total agri-raw imp.
(%)
1000 USD
%
0,0
0,5
1,0
1,5
2,0
2,5
3,0
0
5
10
15
20
25
2008 2009 2010 2011 2012 2013 2014 2015 2016
African Group (million USD)
Asian Group (million USD)
Arab Group (million USD)
OIC Total (million USD)
African share in total fish exp. (%)
Asian share in total fish exp. (%)
Arab share in total fish exp. (%)
OIC share in total fish exp. (%)
million USD
%