


 129 / 272

Reviewing Agricultural Trade Policies
To Promote Intra-OIC Agricultural Trade
117
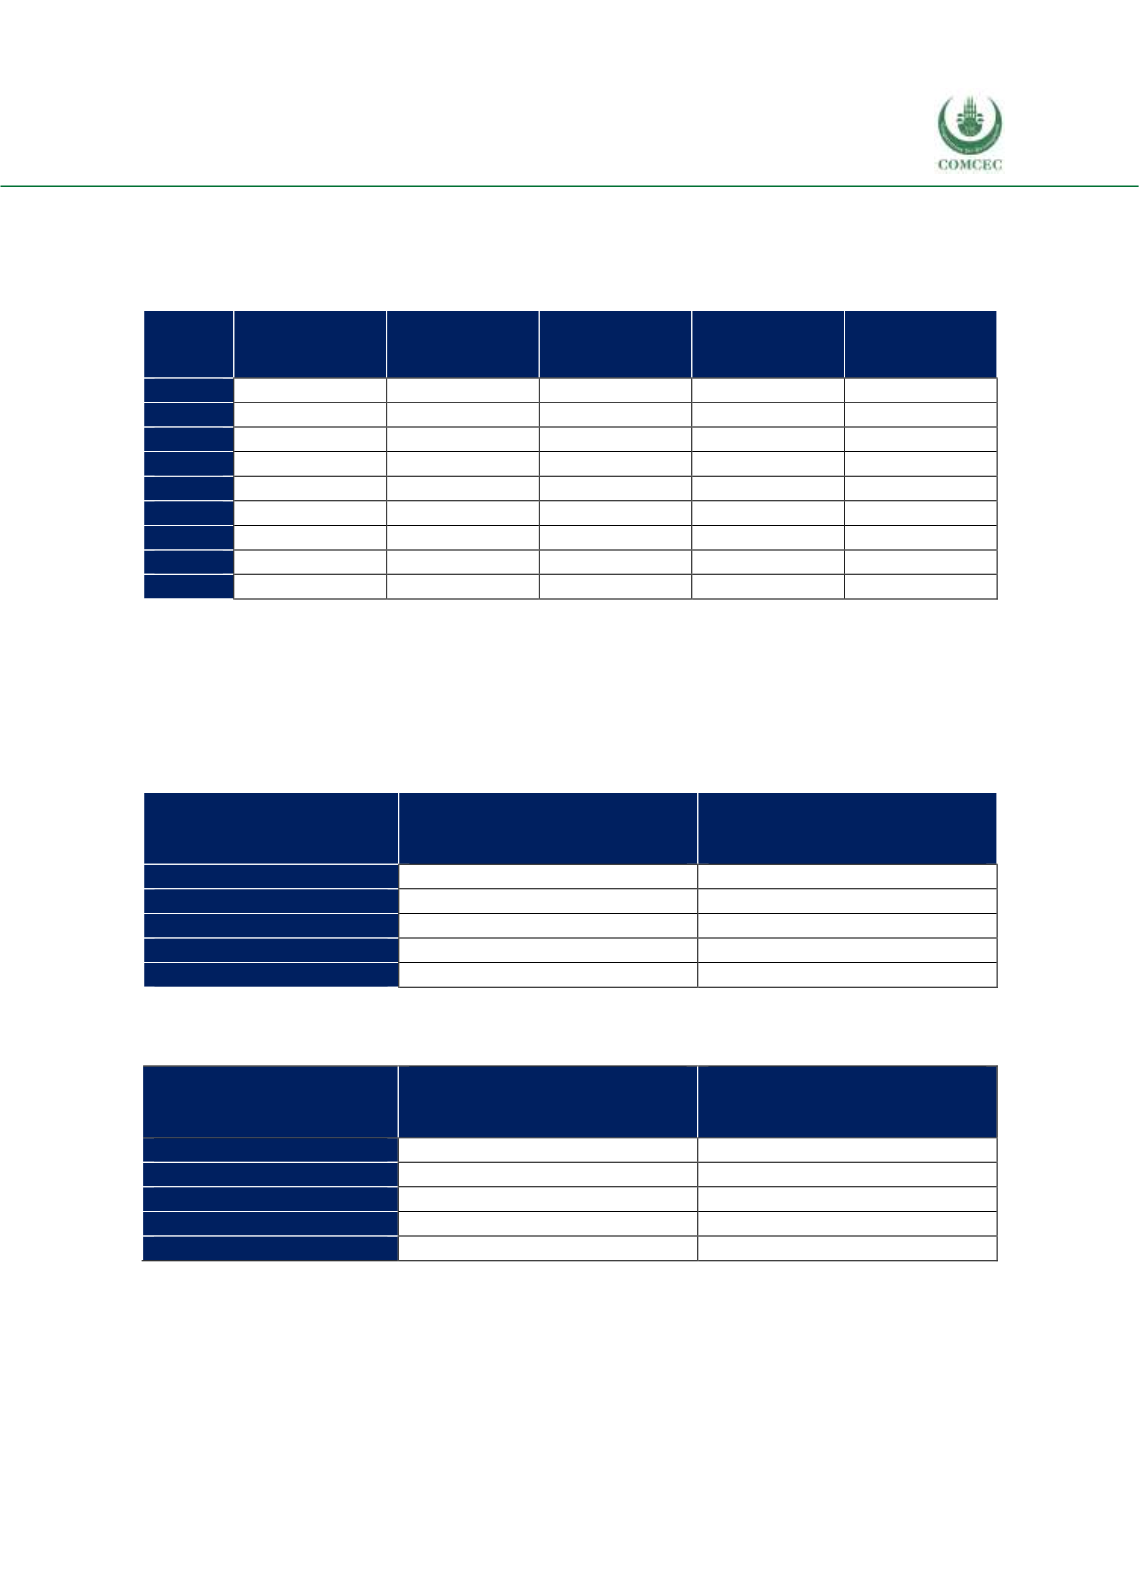
Table 4.29 shows that the share of the non-OIC countries of The Gambia’s top 5 agricultural
import products have declined while the share of the Asian group increased. The share of the
African group increased as well but with fluctuations.
Table 4. 29 Distribution of Gambia’s Top 5 Import Products, by Origin, %
African group
Asian group
Arab group
Non-OIC
Countries
Total
2008
18.9
6.7
4.6
69.8
100
2009
15.7
30.8
2.9
50.6
100
2010
13.1
36.1
4.4
46.4
100
2011
13.7
43.9
2.5
39.9
100
2012
10.5
49.1
2.8
37.6
100
2013
17.9
40.5
2.8
38.9
100
2014
13.1
48.4
1.6
36.9
100
2015
25.5
28.1
4.0
42.4
100
2016
8.5
43.3
2.9
45.3
100
Source: CEPII BACI, Eurostat RAMON, UN Comtrade, UN Trade Statistics, and authors’ calculations
The top 5 countries for which The Gambia’s top 5 export products are sold are, Guine-Bissau,
followed by Senegal and Mali. These three countries are geographically located very close to The
Gambia, creating a favorable condition for transportation of export products. Similarly, the other
top export partners, Tunisia and Mauritania are geographically located in the close
neighborhood of The Gambia.
Table 4. 30 Top 5 OIC Destination Countries for Gambia’s Top 5 Export Products
Importer OIC country
Value of agricultural exports
to the country, million USD,
last 3-year average
% share in total agricultural
exports to the OIC countries,
last 3-year average
Guinea-Bissau
6.2
53.6
Senegal
3.5
30.1
Mali
1.0
9.0
Tunisia
0.3
2.3
Mauritania
0.3
2.2
Source: CEPII BACI, Eurostat RAMON, UN Comtrade, UN Trade Statistics, and authors’ calculations
Table 4. 31 Top 5 OIC Origin Countries for Gambia’s Top 5 Import Products
Exporter OIC country
Value of agricultural imports
from the country, million
USD, last 3-year average
% share in total agricultural
imports from the OIC
countries, last 3-year average
Malaysia
38.3
33.9
Indonesia
24.5
21.7
Senegal
23.4
20.7
Pakistan
11.8
10.5
Turkey
6.1
5.4
Source: CEPII BACI, Eurostat RAMON, UN Comtrade, UN Trade Statistics, and authors’ calculations
With regards to imports of top 5 agricultural products, Malaysia and Indonesia are importers
from far-away countries (Asian group). With the exception of Senegal, the other 4 countries of
The Gambia’s imports are located outside the African group.