


 123 / 272

Reviewing Agricultural Trade Policies
To Promote Intra-OIC Agricultural Trade
111
stable with around 1/3 of total agricultural imports originating from the OIC countries (Table
4.27). Although with fluctuations between 2008 and 2016, the share of OIC countries in
Gambia’s agricultural imports increased to 33.3% in 2016, from 26% in 2008.
Table 4. 27 Value & Share of OIC in the Gambia’s Agricultural Trade
Year
Value (exports)
million USD
Share in Gambia’s
total agricultural
exports, %
Value (imports)
million USD
Share in Gambia’s
total agricultural
imports, %
2008
0.5
4.1
51.4
26.0
2009
0.1
0.3
66.5
27.7
2010
5.3
9.0
102.5
34.2
2011
48.8
31.2
157.3
37.8
2012
22.9
16.1
150.2
40.4
2013
14.5
11.3
165.1
42.0
2014
14.0
11.8
159.4
36.4
2015
0.5
0.5
107.0
33.3
2016
48.4
24.4
119.3
33.3
Source: CEPII BACI, Eurostat RAMON, UN Comtrade, UN Trade Statistics, and authors’ calculations
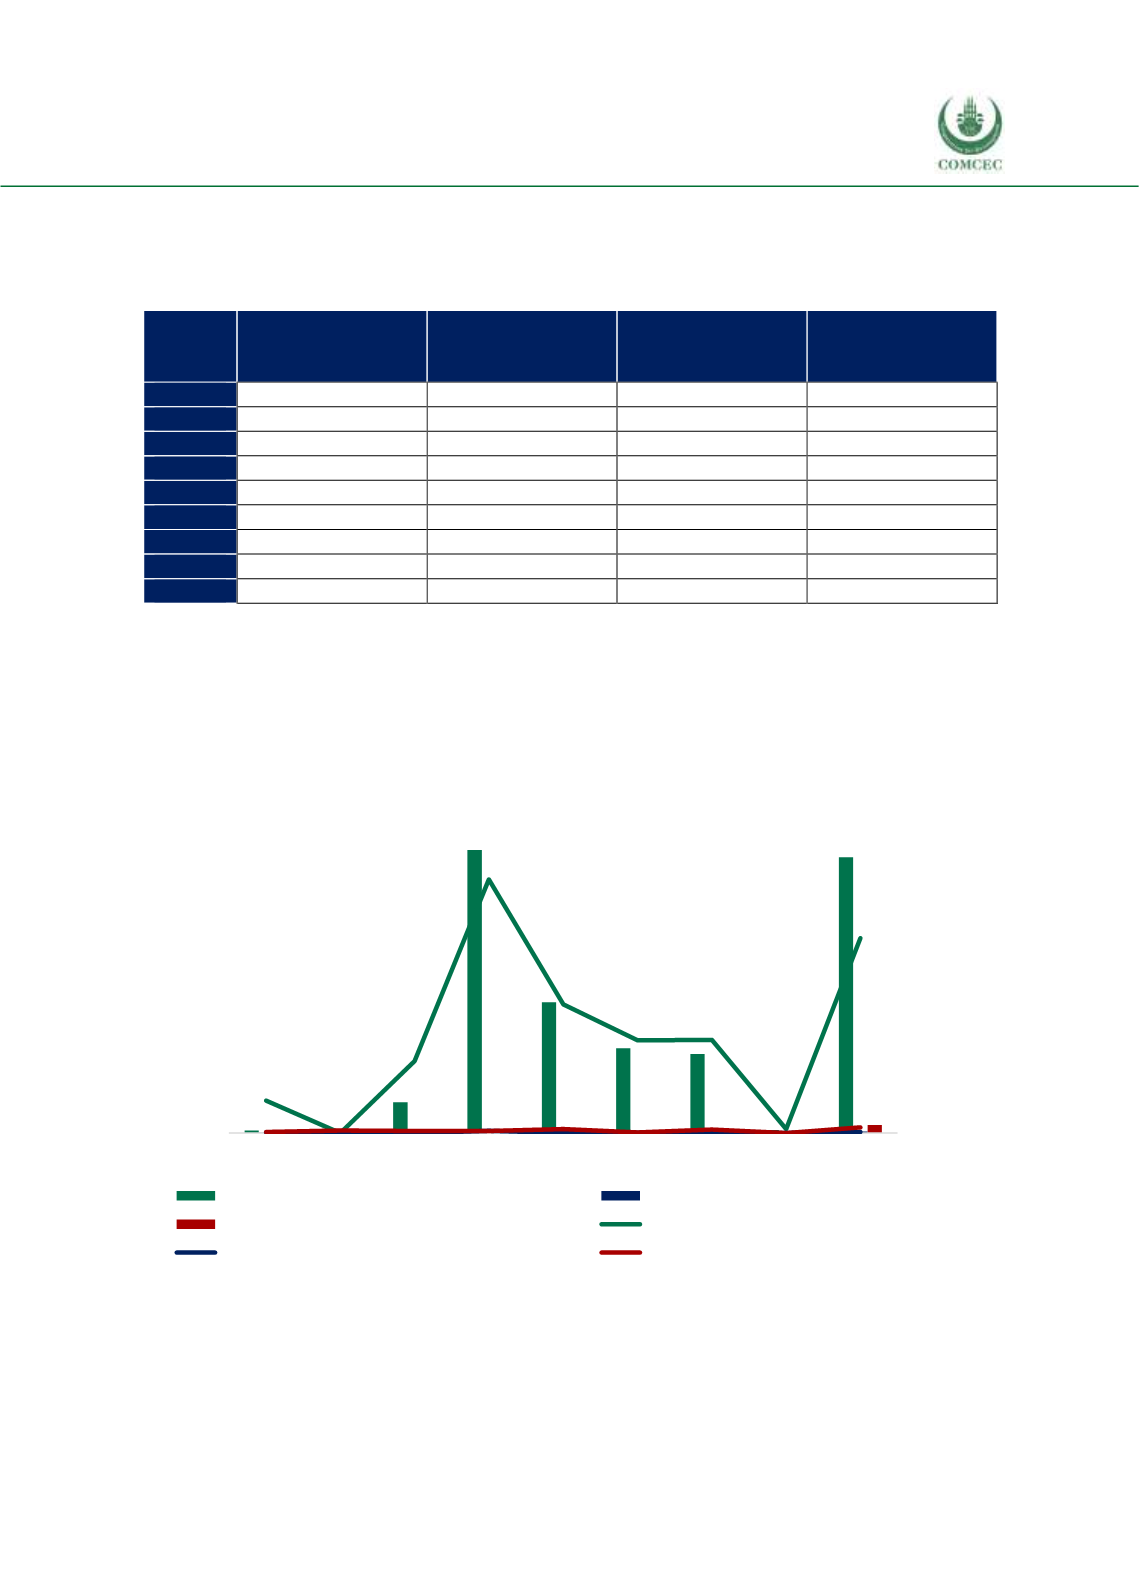
Looking at the distribution of the OIC groups, the African group countries are the major export
partner of Gambia, far surpassing the share of the Asian and Arab group countries (Figure 4.29).
The import share of the African group has been unstable within the total value of Gambian
agricultural product imports. As seen in Figure 4.30, the share of the Asian group is largest
among total exports of Gambian agricultural products, followed by the African group and the
Arab group.
Figure 4. 29 Share of OIC Groups in Gambia’s Agricultural Exports
Source: CEPII BACI, Eurostat RAMON, UN Comtrade, UN Trade Statistics, and authors’ calculations
0
7
14
21
28
35
42
49
0
5
10
15
20
25
30
35
2008 2009 2010 2011 2012 2013 2014 2015 2016
million USD
African Group (million USD)
Asian Group (million USD)
Arab Group (million USD)
African share in total agricultural exp. (%)
Asian share in total agricultural exp. (%)
Arab share in total agricultural exp. (%)
%