


 121 / 272

Reviewing Agricultural Trade Policies
To Promote Intra-OIC Agricultural Trade
109
30%. The share of imports remained relatively same during the 2008-2016, with a slight
increase.
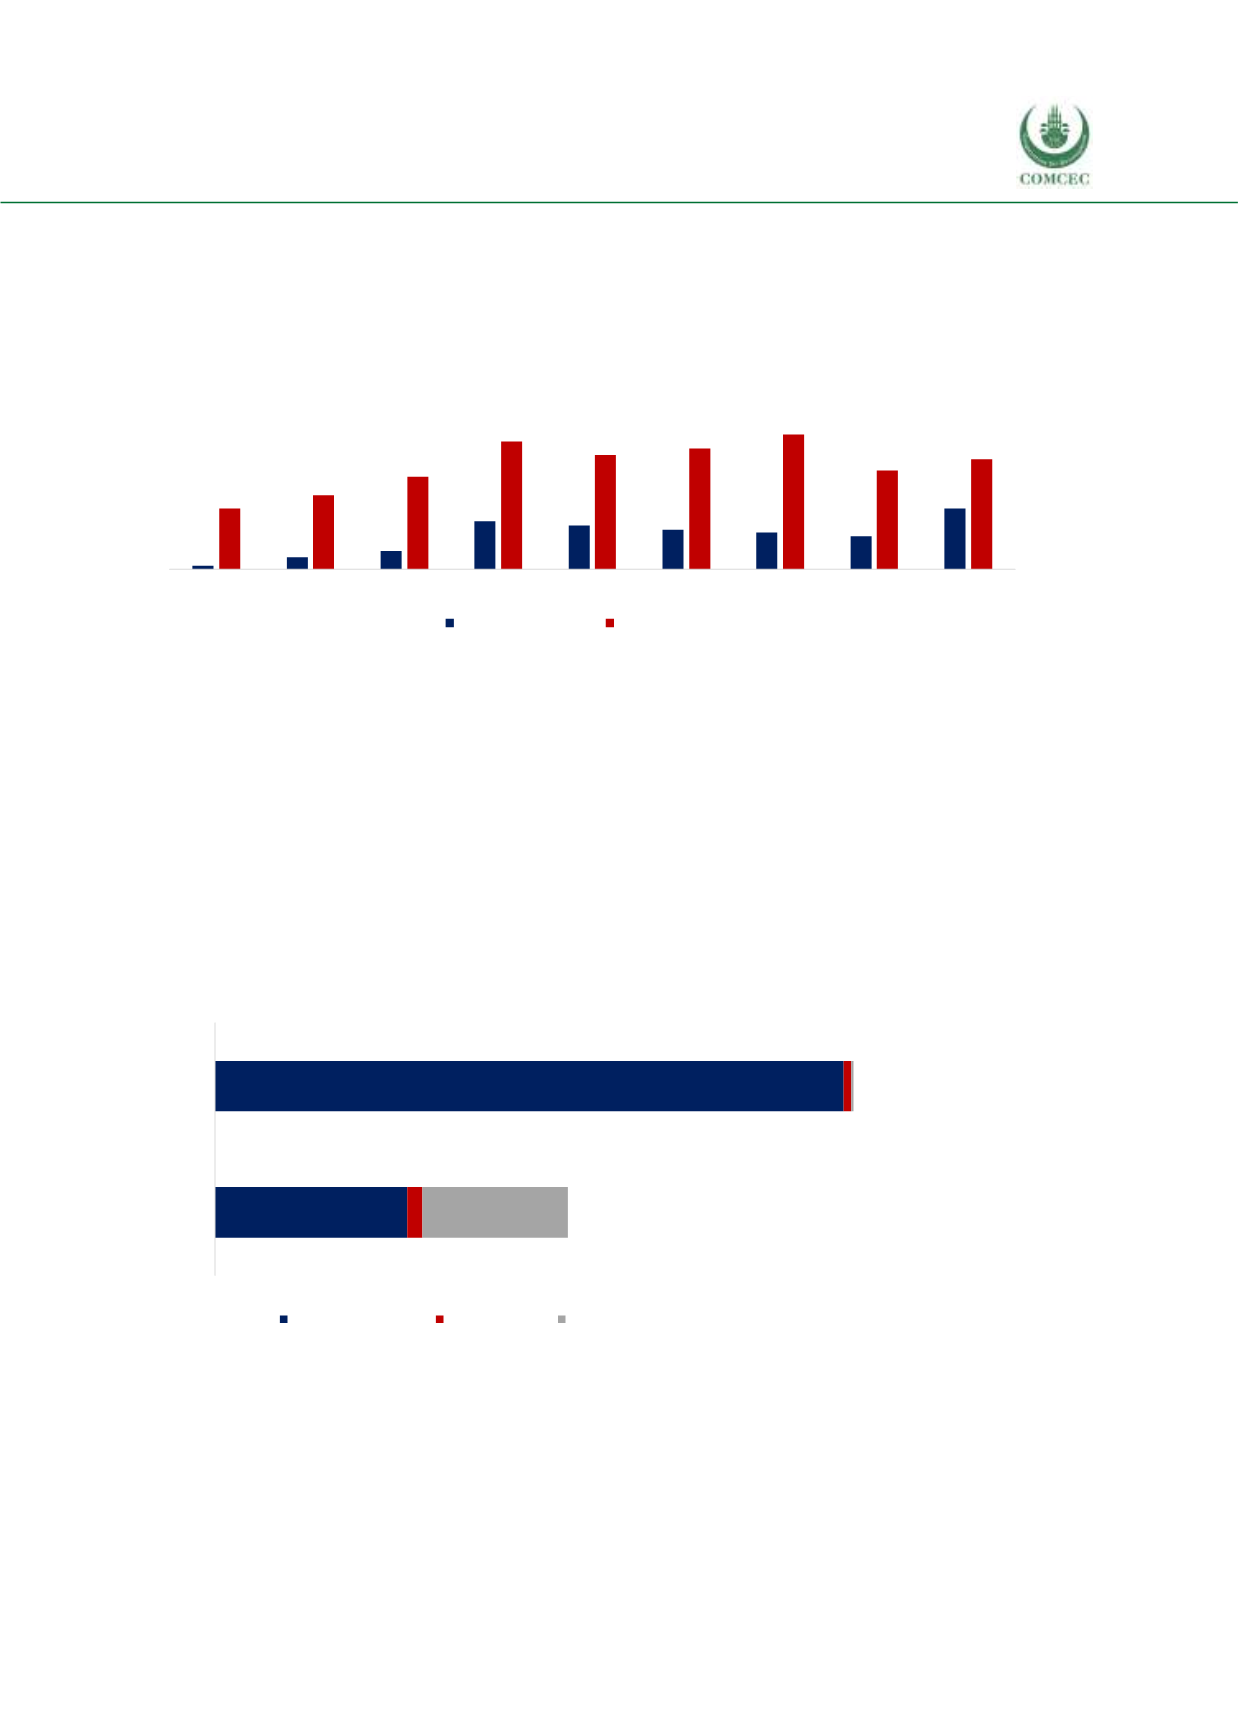
Figure 4.25 presents agricultural exports and imports where import value is greater the value
of exports, representing a trade deficit across the years.
Figure 4. 25 Agricultural Exports and Imports, Million USD, Gambia
Source: CEPII BACI, Eurostat RAMON, UN Comtrade, UN Trade Statistics, and authors’ calculations
Within subgroups of agricultural products,
Exports of agri-food products were 107.7 million USD and imports of agri-food products
were 352.6 million USD with a trade deficit of 244.9 million USD in 2016.
Exports of agricultural raw materials were 81.7 million USD and imports of agricultural
raw materials were 1.3 million USD with a trade surplus of 80.4 million USD in 2016.
Exports of fish products were 8.6 million USD and imports of fish products were 4.2
million USD with a trade surplus of 4.4 million USD in 2016
The Gambia is a large importer of agri-food products with a share of 98% in total
imports in 2016 (see Figure 4.26).
Figure 4. 26 Agricultural Exports and Imports, Product Groups, Million USD, Gambia, 2016
Source: CEPII BACI, Eurostat RAMON, UN Comtrade, UN Trade Statistics, and authors’ calculations
Trade policies in Gambia in terms of preferential trade agreements have been influenced by
Economic Community of West African States (ECOWAS) agreements. Most of the free trade
agreements are developed in parallel to this trade bloc. Currently, Gambia is part of free trade
agreements with 14 countries worldwide including 11 OIC member countries (Benin, Burkina
11.3
38.3
59.7
156.2
142.4
127.7
118.8
108.2
198.0
198.1
239.6
300.0
416.2
371.8
392.9
437.7
321.1
358.1
2008
2009
2010
2011
2012
2013
2014
2015
2016
Agircultural export
Agircultural import
Agri-food products;
107.7
Agri-food products;
352.6
Fish products; 8.6
Fish products; 4.2
Agri-rawmaterials;
81.7
Agri-rawmaterials; 1.3
-
50.0
100.0
150.0
200.0
250.0
300.0
350.0
400.0
Export
Import
Agri-food products
Fish products
Agri-rawmaterials