


 125 / 272

Reviewing Agricultural Trade Policies
To Promote Intra-OIC Agricultural Trade
113
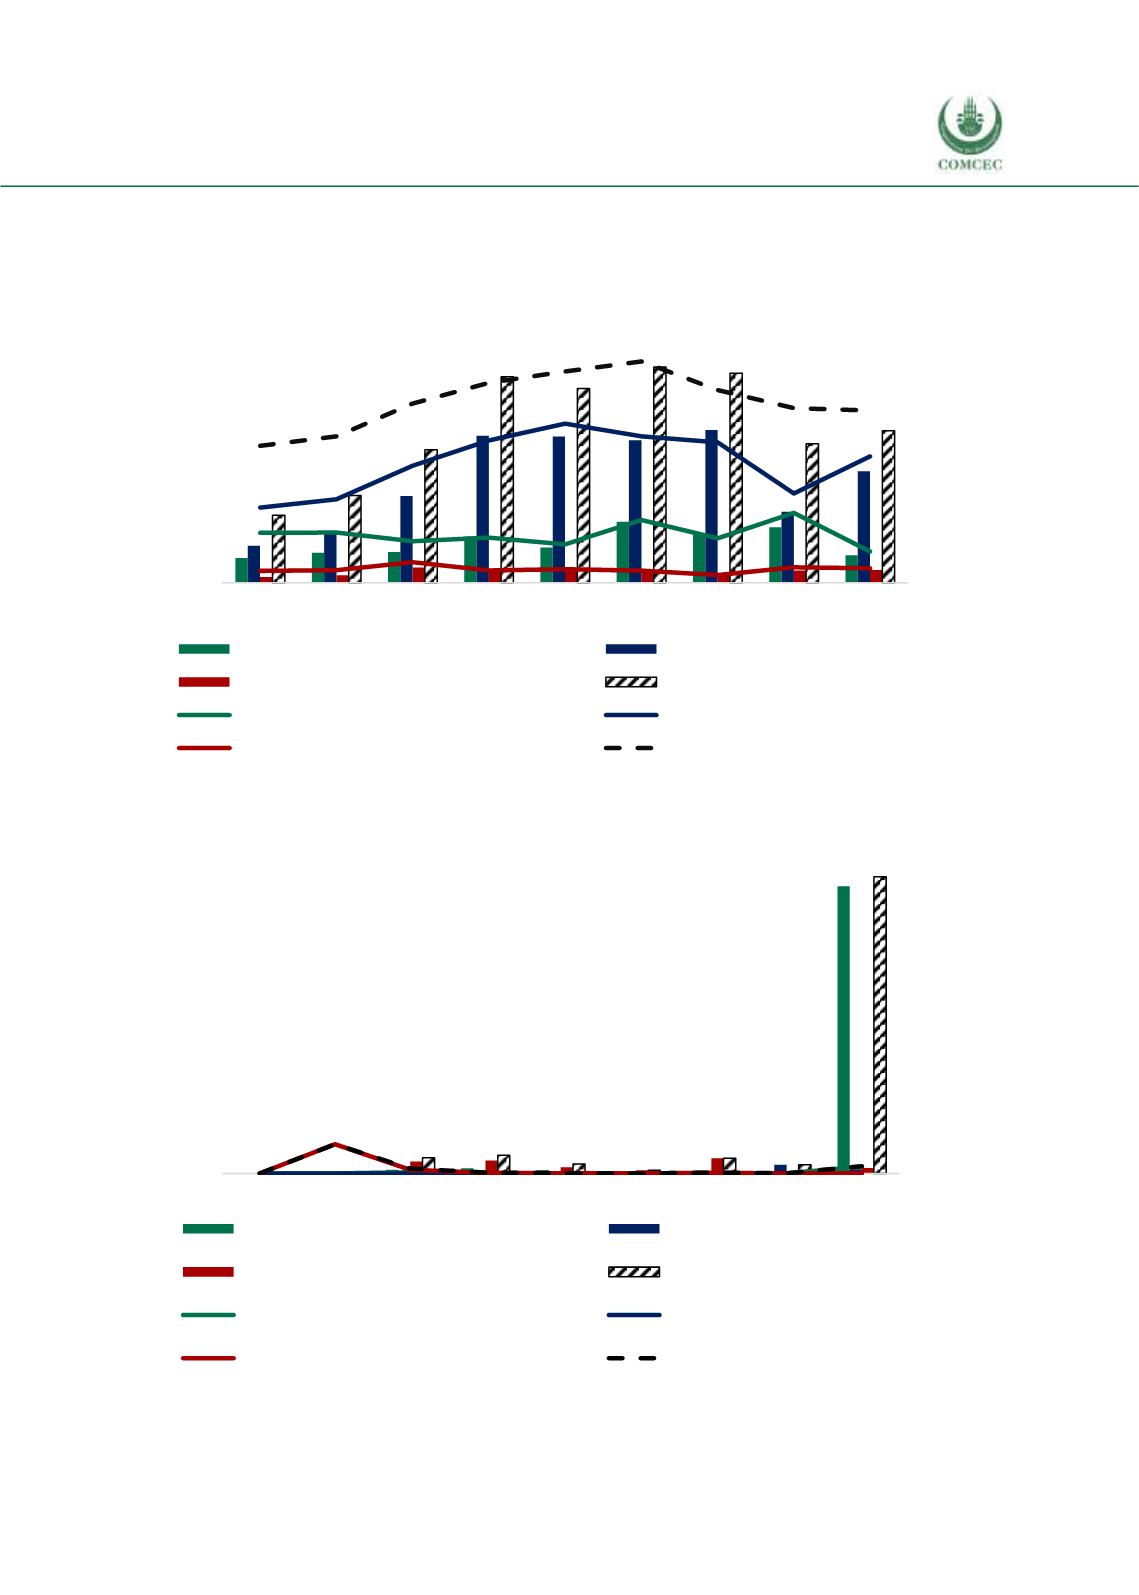
with the 2016 share of 32.5%. The Asian group’s share in total agri food imports is largest
followed by the African and the Arab group’s shares.
Figure 4. 32 Imports of Gambia’s Agri-Food Products from the OIC Groups
Source: CEPII BACI, Eurostat RAMON, UN Comtrade, UN Trade Statistics, and authors’ calculations
Figure 4. 33 Exports of Gambia’s Agricultural Raw Materials to the OIC Groups
Source: CEPII BACI, Eurostat RAMON, UN Comtrade, UN Trade Statistics, and authors’ calculations
0
40
80
120
160
200
0
10
20
30
40
50
2008 2009 2010 2011 2012 2013 2014 2015 2016
African Group (million USD)
Asian Group (million USD)
Arab Group (million USD)
OIC Total (million USD)
African share in total agri-food imp. (%)
Asian share in total agri-food imp. (%)
Arab share in total agri-food imp. (%)
OIC share in total agri-food imp. (%)
%
million USD
0
80
160
240
320
400
480
560
640
720
800
0
4
8
12
16
20
24
28
32
36
40
2008 2009 2010 2011 2012 2013 2014 2015 2016
African Group (1000 $)
Asian Group (1000 $ USD)
Arab Group (1000 $)
OIC Total (1000 $)
African share in total agri-raw exp. (%)
Asian share in total agri-raw exp. (%)
Arab share in total agri-raw exp. (%)
OIC share in total agri-raw exp.
(%)
1000 USD
%