


 124 / 272

Reviewing Agricultural Trade Policies
To Promote Intra-OIC Agricultural Trade
112
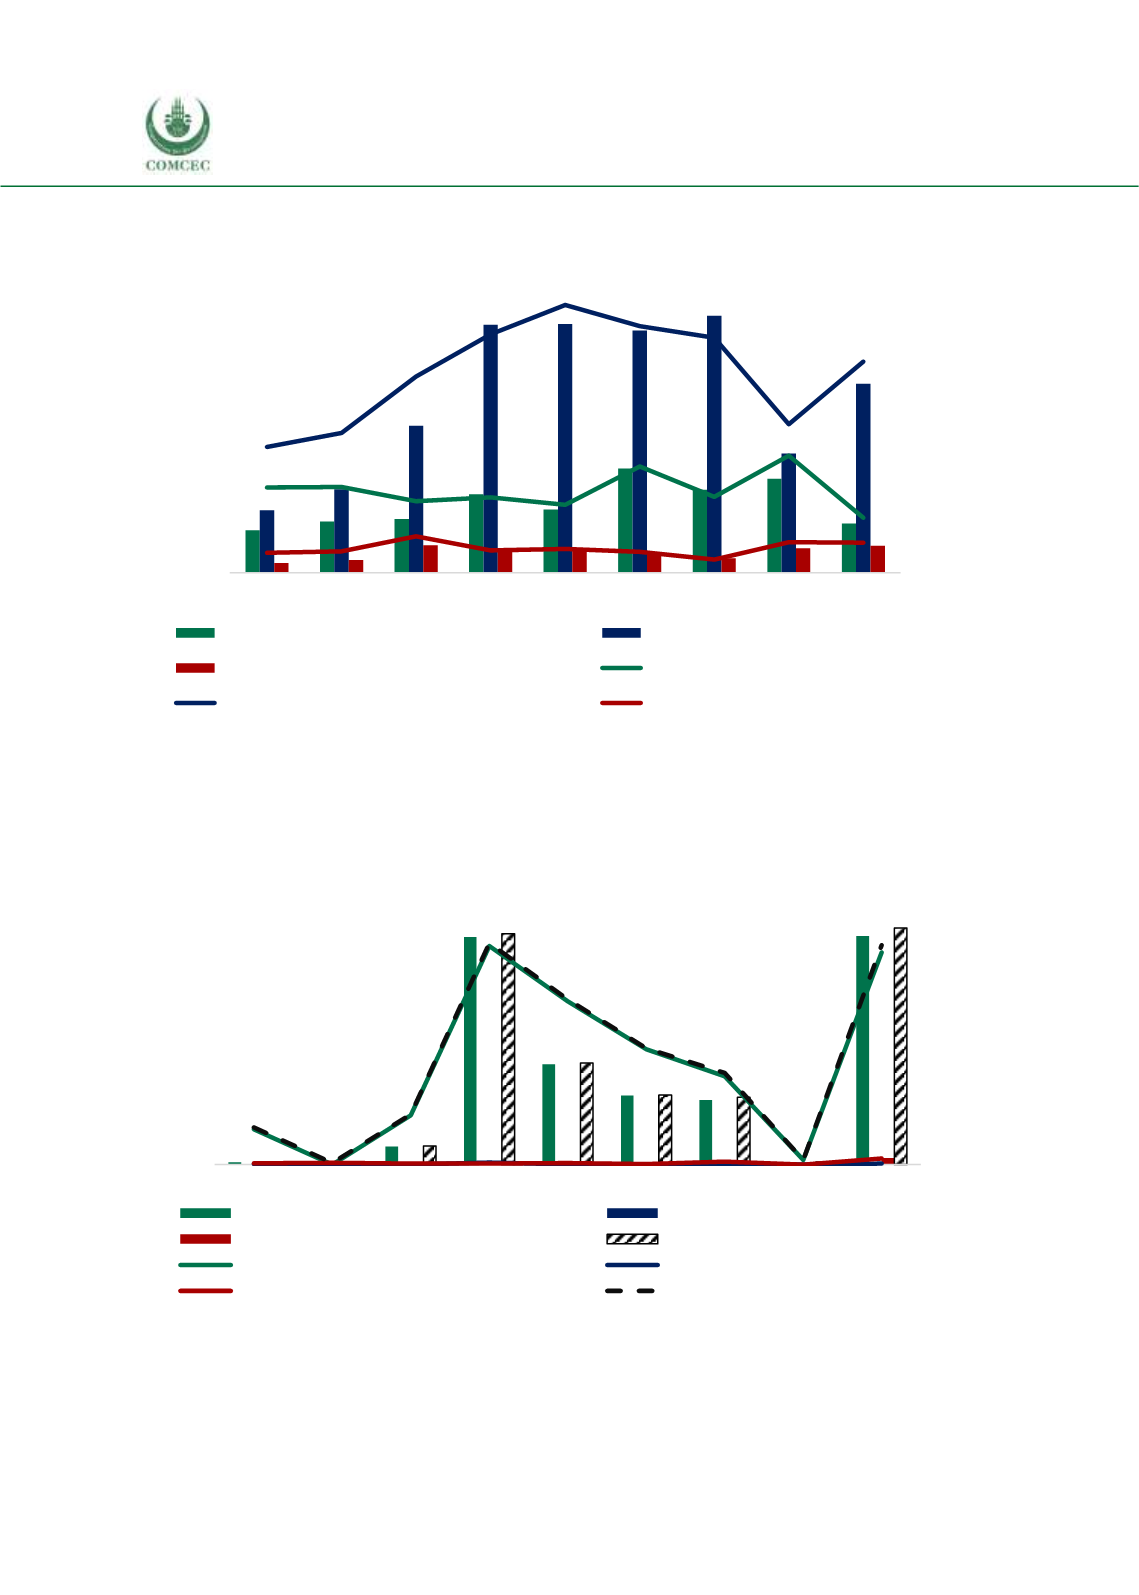
Figure 4. 30 Share of OIC Groups in Gambia’s Agricultural Imports
Source: CEPII BACI, Eurostat RAMON, UN Comtrade, UN Trade Statistics, and authors’ calculations
Figure 4.31 shows that the African group is the largest export partner of Gambia in agri-food
product exports. Exports of the agri-food products to the African group constitutes almost all of
the total Gambian exports of agri-food products to the OIC countries. The shares of the Arab and
the Asian group in Gambia’s total agri-food exports are in negligible values and percentages.
Figure 4. 31 Exports of Gambia’s Agri-Food Products to the OIC Groups
Source: CEPII BACI, Eurostat RAMON, UN Comtrade, UN Trade Statistics, and authors’ calculations
With regards to imports of agri-food products, the situation is quite different. Figure 4.32 shows
that The share of OIC imports of agri-food products is within the range of 25.8 % and 41.8 %
0
20
40
60
80
100
120
140
0
5
10
15
20
25
30
35
2008 2009 2010 2011 2012 2013 2014 2015 2016
African Group (million USD)
Asian Group (million USD)
Arab Group (million USD)
African share in total agricultural imp. (%)
Asian share in total agricultural imp. (%)
Arab share in total agricultural imp. (%)
million USD
%
0
10
20
30
40
50
0
10
20
30
40
50
2008 2009 2010 2011 2012 2013 2014 2015 2016
African Group (million USD)
Asian Group (million USD)
Arab Group (million USD)
OIC Total (million USD)
African share in total agri-food exp. (%)
Asian share in total agri-food exp. (%)
Arab share in total agri-food exp. (%)
OIC share in total agri-food exp. (%)
million USD
%