


 128 / 272

Reviewing Agricultural Trade Policies
To Promote Intra-OIC Agricultural Trade
116
Top 5 Agricultural export and import products of The Gambia in the OIC Markets
According to the latest available three-year averages (2014-2016), the products that have the
top five shares in Gambia’s total agricultural exports to the OIC countries are (top 5 agricultural
export products to the OIC):
09: Miscellaneous p.
41-42-43: Oils, fats, waxes
08: Feeding stuff for animals
02: Dairy
11-12: Beverages, tobacco
with percentage shares of 19.4%, 15.5%, 11.3%, 9.6%, and 8.5%, respectively.
With regards to Gambia’s top agricultural imports from the OIC countries, according to the latest
available three year averages (2014-2016), the products that have the top five shares in
Gambia’s total agricultural imports from the OIC countries are (top 5 agricultural import
products from the OIC):
41-42-43: Oils, fats, waxes
09: Miscellaneous p.
04: Cereals
02: Dairy
07: Coffee, tea, cocoa, spices
with percentage shares of 38.5%, 22.0%, 16.5%, 5.9%, and 4.5%, respectively.
The products in the two lists are not mutually exclusive. “Oils, fats, waxes”, “miscellaneous
products” and “dairy” are products that are both commonly exported to and imported from OIC
countries. The reason may be that the combinations of the product groups according to higher
digits are different and that export products and import products at higher digit SITC levels are
different.
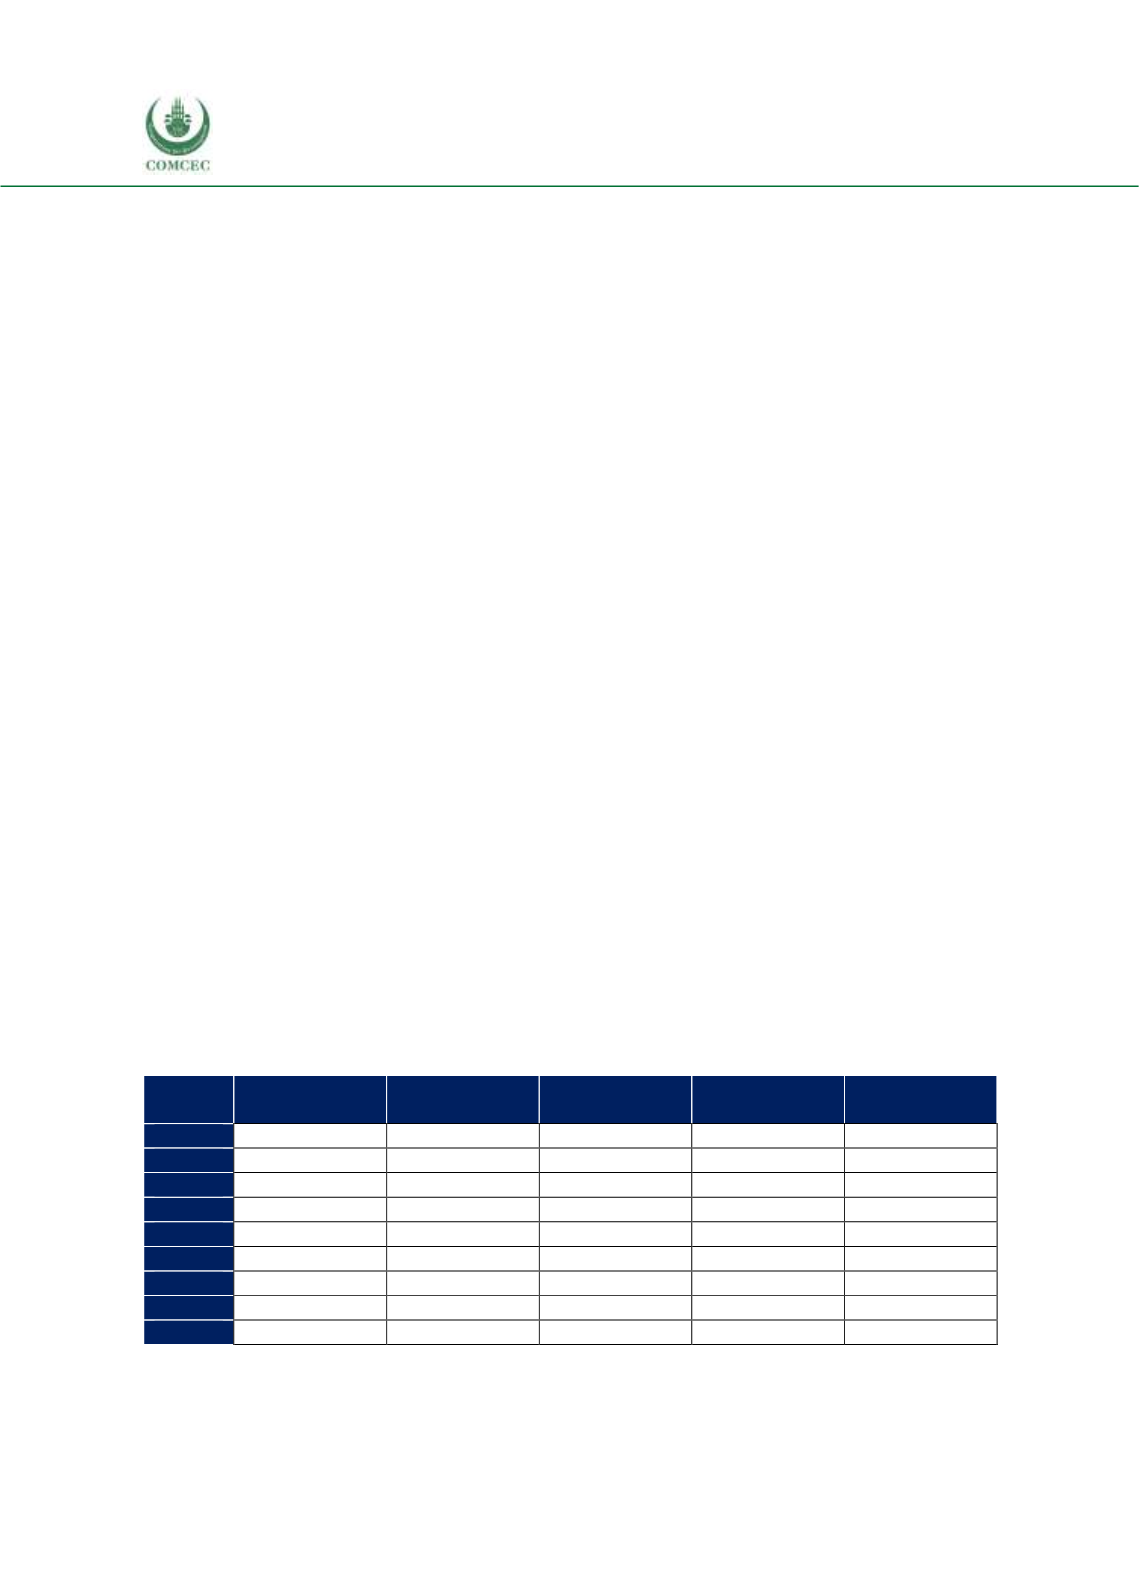
Table 4.28 shows that non-OIC countries generally have had a large share in The Gambian
exports of top 5 export agricultural products. The share declined over the years, yet with large
fluctuations. The share of the Asian group and the Arab group is minimum. The African group’s
share changes across the years without showing a stable increase. However, despite instability
in shares, it is possible to say that the share of non-OIC countries in export of top agricultural
products decreased in favor of the exports to the African group countries.
Table 4. 28 Distribution of Gambia’s Top 5 Export Products, by Destination, %
African group
Asian group
Arab group
Non-OIC
Countries
Total
2008
16.2
0.6
83.2
100
2009
0.5
99.5
100
2010
14.3
0.1
85.6
100
2011
39.2
0.2
60.5
100
2012
55.2
0.0
0.4
44.3
100
2013
81.7
18.3
100
2014
59.5
0.4
1.8
38.3
100
2015
6.0
94.0
100
2016
76.1
0.7
4.3
19.0
100
Source: CEPII BACI, Eurostat RAMON, UN Comtrade, UN Trade Statistics, and authors’ calculations