


 122 / 272

Reviewing Agricultural Trade Policies
To Promote Intra-OIC Agricultural Trade
110
Faso, Cote d’Ivoire, Guinea, Guinea-Bissau, Mali, Niger, Nigeria, Senegal, Sierra Leone, and Togo)
(WTO, RTA-IS).
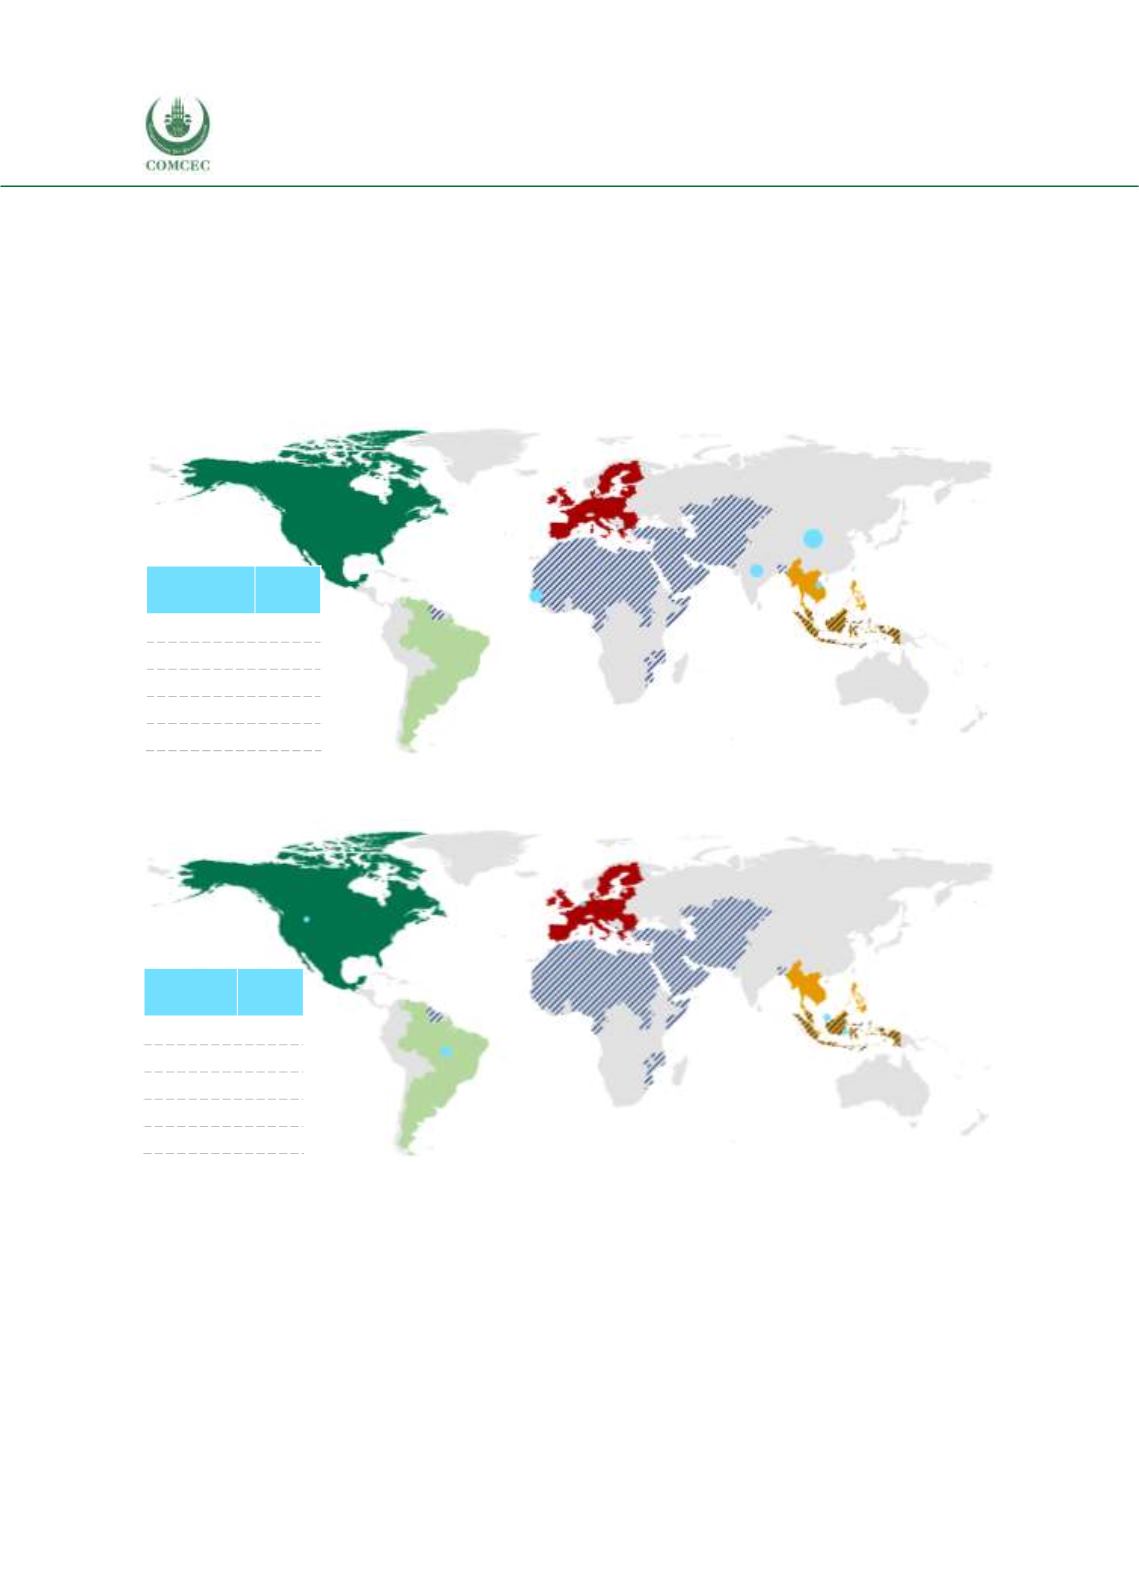
Figures 4.27 and 4.28 present breakdown of agricultural export destinations and import
countries of origins of the Gambia. China is the top export partner for Gambian agricultural
products. The share of OIC group in total agricultural exports is 24% and in agricultural imports
is 33% in 2016. The Gambian top agricultural import partners are Brazil and Malaysia, followed
by Indonesia, USA and the Netherlands.
Figure 4. 27 Breakdown of Gambia’s Agricultural Export Destinations, 2016
Source: CEPII BACI, Eurostat RAMON, UN Comtrade, UN Trade Statistics, authors’ visualizations
Figure 4. 28 Breakdown of Gambia’s Agricultural Import Origins, 2016
Source: CEPII BACI, Eurostat RAMON, UN Comtrade, UN Trade Statistics, authors’ visualizations
4.3.1. Agricultural Trade with the OIC Countries
General overview
As shown in Table 4.27, the share of OIC Countries in The Gambia’s total agricultural exports
have not been in stable percentages over the years. The share of OIC in Gambia’s total
agricultural exports varies from 0.3% to 31.2% with sharp discrepancies from one year to the
next year. The share of OIC countries in Gambia’s agricultural imports have been relatively
EU-28
%8
NAFTA
%0
MERCOSUR
%0
ASEAN
%6
OIC %24
Top 5
Partner
Share
China
41%
Guinea-Bissau 20%
India
20%
Viet Nam
6%
Senegal
3%
EU-28
%20
NAFTA
%6
MERCOSUR
%24
ASEAN
%20
OIC %33
Top 5
Partner
Share
Brazil
22%
Malaysia
11%
Indonesia
8%
USA
6%
Netherlands
6%