


 127 / 272

Reviewing Agricultural Trade Policies
To Promote Intra-OIC Agricultural Trade
115
volumes. The share of Arab group increased slightly in 2012 but declined back to almost zero
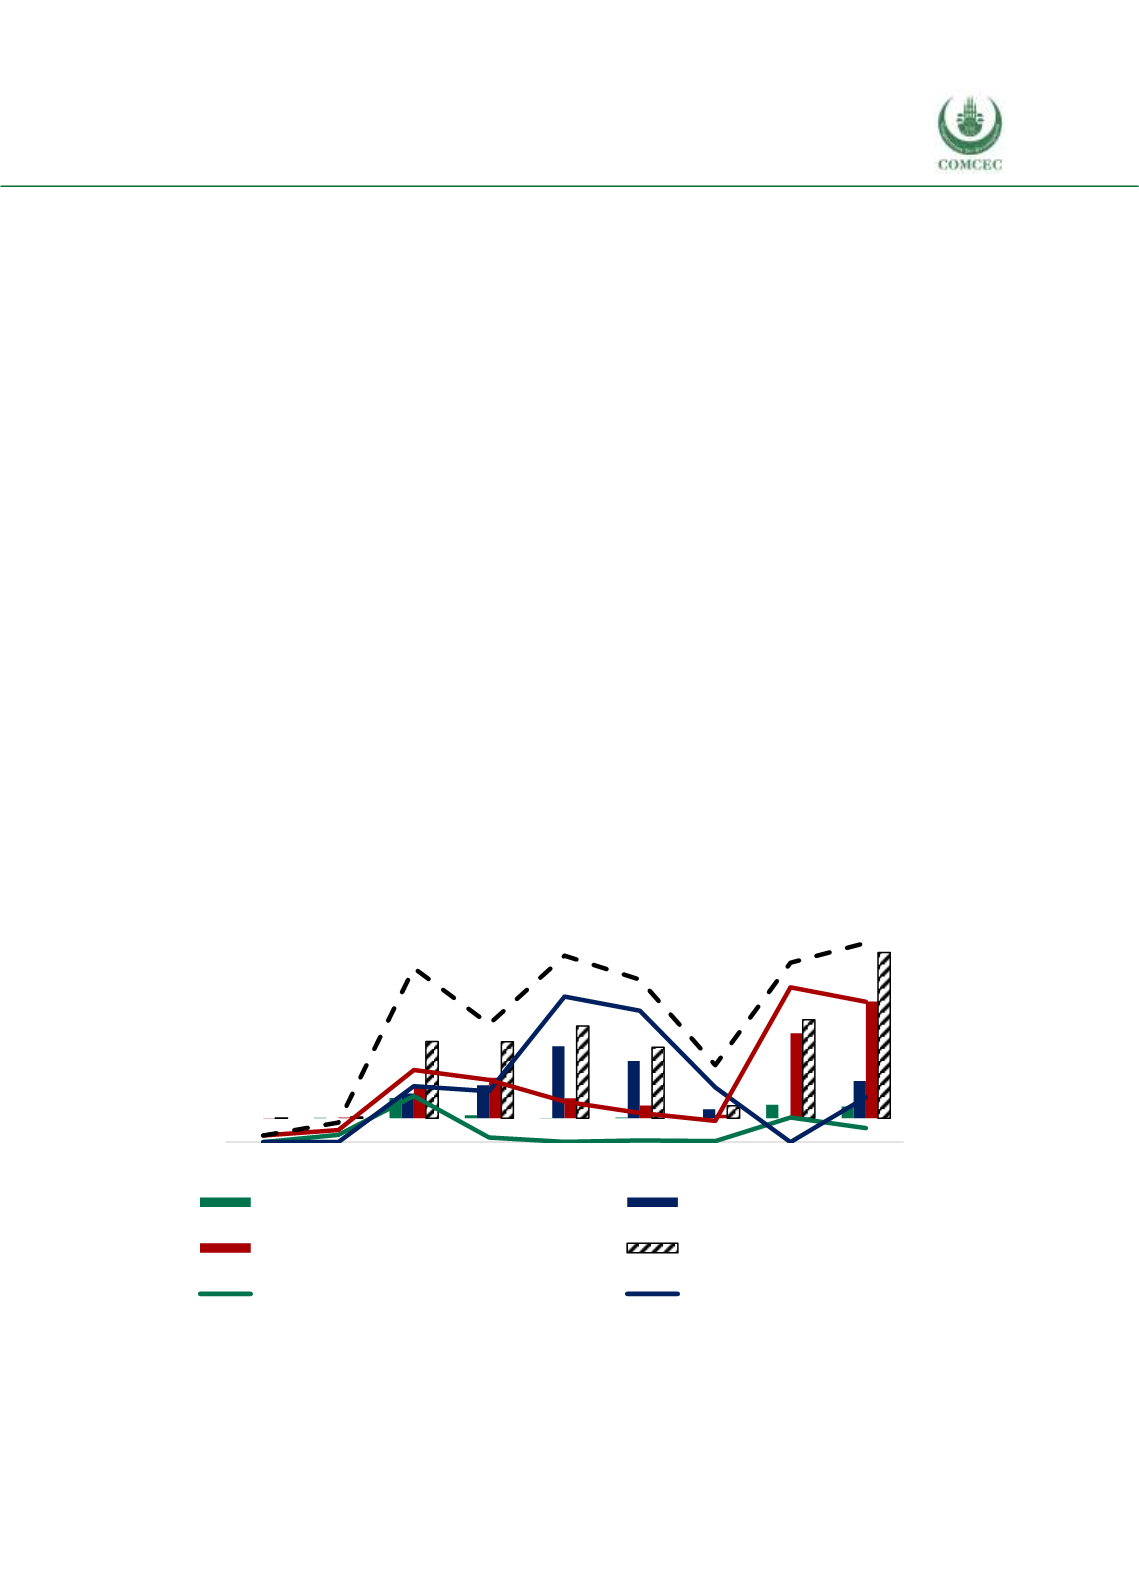
shares. Figure 4.36 demonstrates the fish imports of The Gambia from the OIC countries. The
OIC share in total fish imports has increased over time, from 2.8% in 2008 to 83.5% in 2016.
While the shares of the three country groups of the OIC was close in 2008, the share of the Asian
group increased during the 2011-2013 period and then declined in 2014 at the expense of the
imports of fish from the Arab group. The African group’s share has been quite stable, but lower
than the Asian and Arab group’s share.
In summary,
The share of the OIC countries in The Gambia’s total agricultural exports is extremely
fluctuating. There is no stability across the years.
The OIC group’s share in The Gambia’s agricultural imports is relatively stable,
constituting around 1/3 of the total.
Almost entire agri-food exports of The Gambia to the OIC group is directed towards the
African group countries.
The principal origin of The Gambia’s imports of agri-food products is the Asian group,
followed by the African group.
The share of the OIC group in agri-rawmaterial exports of The Gambia is very small with
the exception of 2016 with a large increase of exports to the African group countries.
The share of the African group in The Gambia’s OIC imports of agri-raw materials is
largest across the years.
The Gambian fish exports to the OIC countries do not show a stable pattern, majority of
fish exports going to the African markets.
Imports of fish from the OIC countries increased (with fluctuations) over time. The share
of the Arab group in fish imports increased at the expense of the Asian group in fish in
The Gambia’s imports of fish from the OIC countries.
Figure 4. 36 Imports of Gambia’s Fish Products from the OIC Groups
Source: CEPII BACI, Eurostat RAMON, UN Comtrade, UN Trade Statistics, and authors’ calculations
-0,5
0,5
1,5
2,5
3,5
4,5
0
20
40
60
80
100
2008 2009 2010 2011 2012 2013 2014 2015 2016
African Group (million USD)
Asian Group (million USD)
Arab Group (million USD)
OIC Total (million USD)
African share in total fish imp. (%)
Asian share in total fish imp. (%)
million USD
%