


 32 / 113

COMCEC Trade Outlook 2017
26
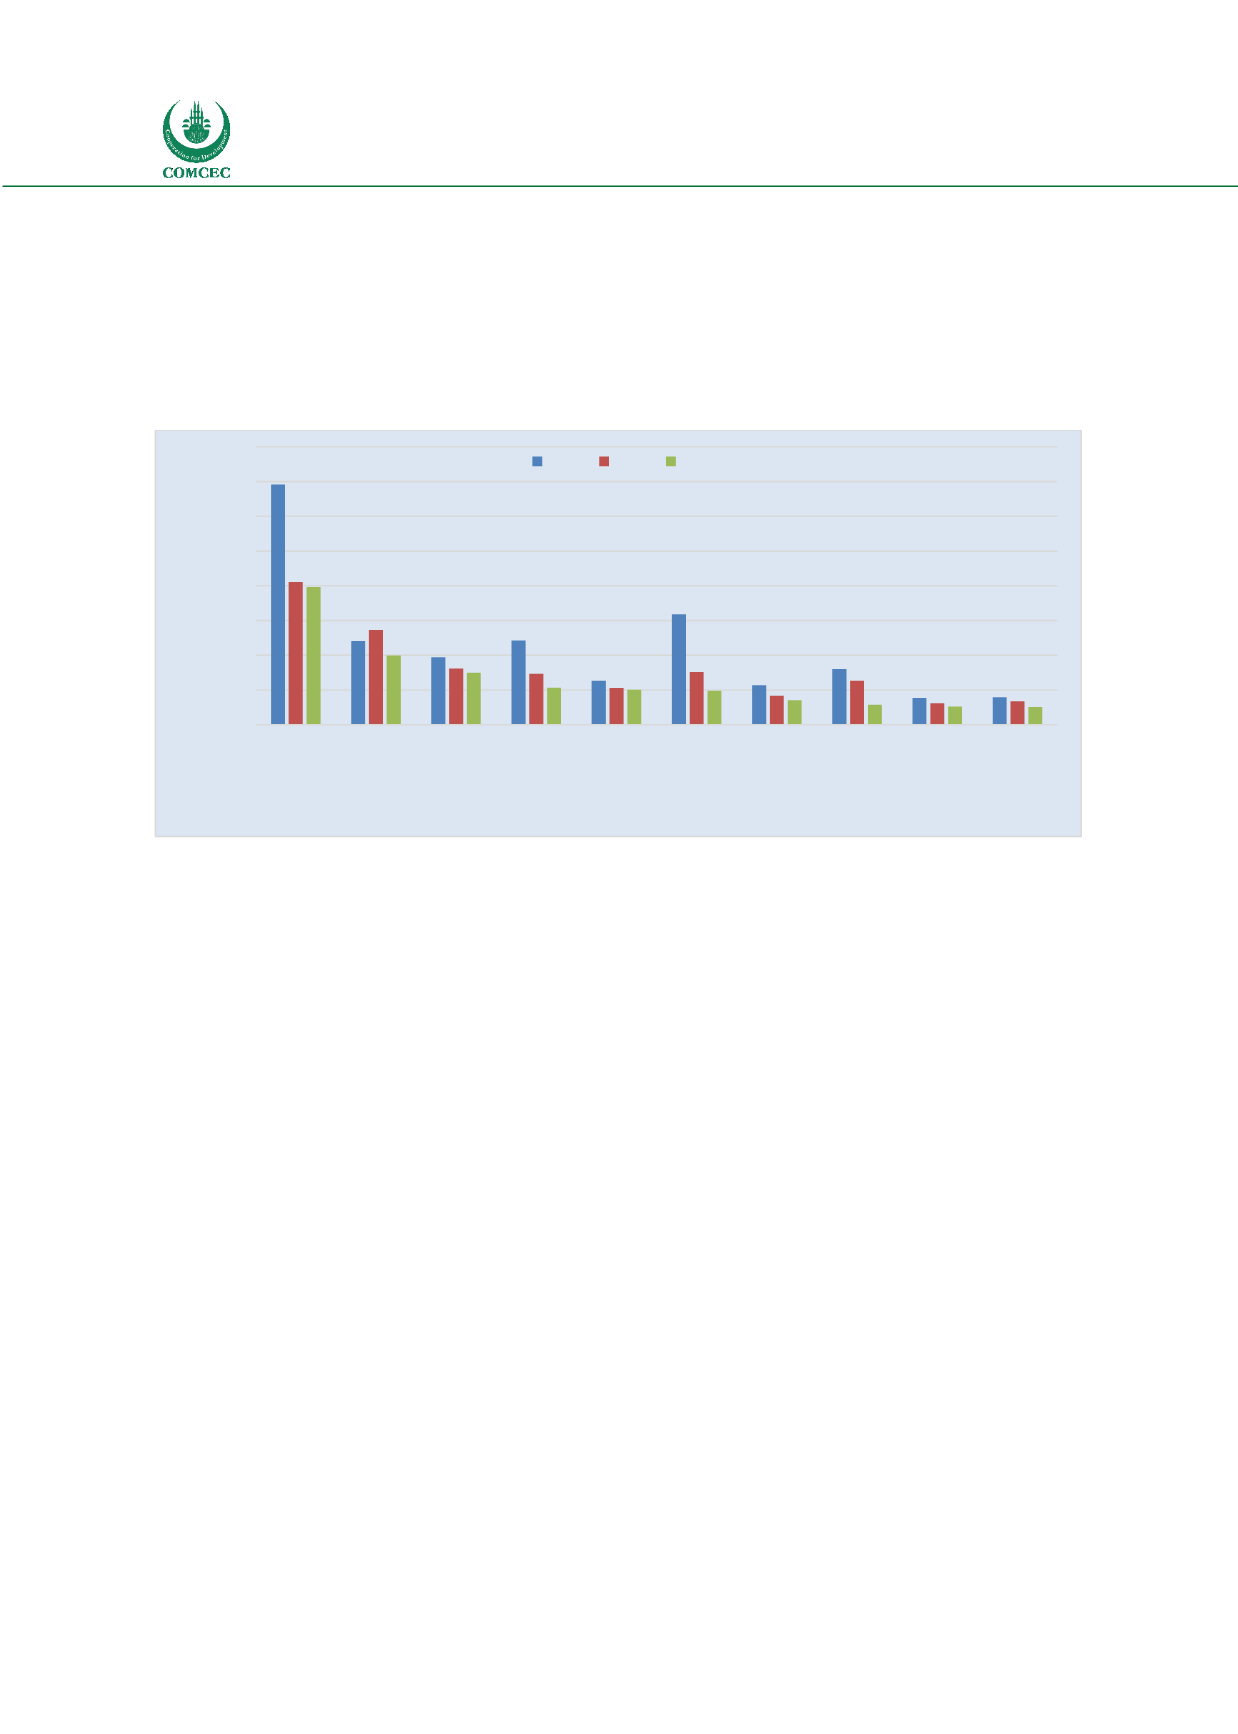
total intra-OIC exports, share of mineral fuels, oils and related products was 17.8 per cent,
followed by pearls, precious stones (8.9 per cent), plastics and articles (6.7 per cent), and
machinery and nuclear reactors with 4.8 per cent. In 2016 intra OIC exports declined in most
sectors but the decline in the intra exports of natural or cultured pearls, precious stone, vehicles
other than railway or tramway, electrical machinery and equipment and machinery as a whole
account for half of the decline in intra-OIC exports.
Figure 29: Evolution of Intra OIC Exports by Top 10 Items-2016
Source: ITC Trade map
The country breakdown of intra OIC trade which is provided in Appendix 4 reveals that intra
trade is highly concentrated as the sum of top three trading partners to total intra trade has a
very high ratio both in intra exports and intra imports. Moreover, it is observed that the
geographical proximity seems to be a major determinant of intra trade. Trade costs gets higher
with the distance between countries. This could be one of the factors accounting for the high
concentration of intra trade with the nearby countries.
0
10
20
30
40
50
60
70
80
Mineral fuels,
mineral oils
pearls, precious
or semi-
precious stones
Plastics and
articles thereof
Machinery,
mechanical
appliances
Animal or
vegetable fats
and oils
Electrical
machinery and
equipment
Iron and steel
Vehicles other
than railway or
tramway
Articles of iron
or steel
Aluminium and
articles thereof
Billion dollars
2014 2015 2016