


 27 / 113

COMCEC Trade Outlook 2017
21
Table 4: Top Ten Manufactures Exporters by Degree of Manufacturing
14
, 2016 (per cent)
Share of
Manufacturing
in Total OIC
Manufacturing
Share of
Manufacturing
in Country's
Total Exports
Manufactured
goods by
degree of
manufacturing
Labour-
intensive and
resource-
intensive
manufactures
Low-skill and
technology-
intensive
manufactures
Medium-skill
and
technology-
intensive
manufactures
High-skill
and
technology-
intensive
manufactures
Malaysia
21.9
68.0
100.0
10.2
4.4
19.8
65.6
Turkey
18.3
75.5
100.0
32.7
13.5
39.5
14.4
UAE
16.1
35.6
100.0
10.9
10.5
29.7
48.9
Indonesia
11.5
46.8
100.0
37.7
9.0
24.4
28.9
Saudi Arabia
7.5
25.3
100.0
4.4
4.9
5.2
85.5
Bangladesh
5.5
94.6
100.0
97.5
0.7
0.8
1.0
Pakistan
2.6
75.6
100.0
84.9
2.0
4.3
8.8
Morocco
2.6
66.5
100.0
30.6
1.7
36.4
31.3
Egypt
2.0
45.6
100.0
38.2
8.6
15.9
37.3
Iran
1.9
16.8
100.0
12.4
9.8
7.1
70.7
Source: UNCTADSTAT
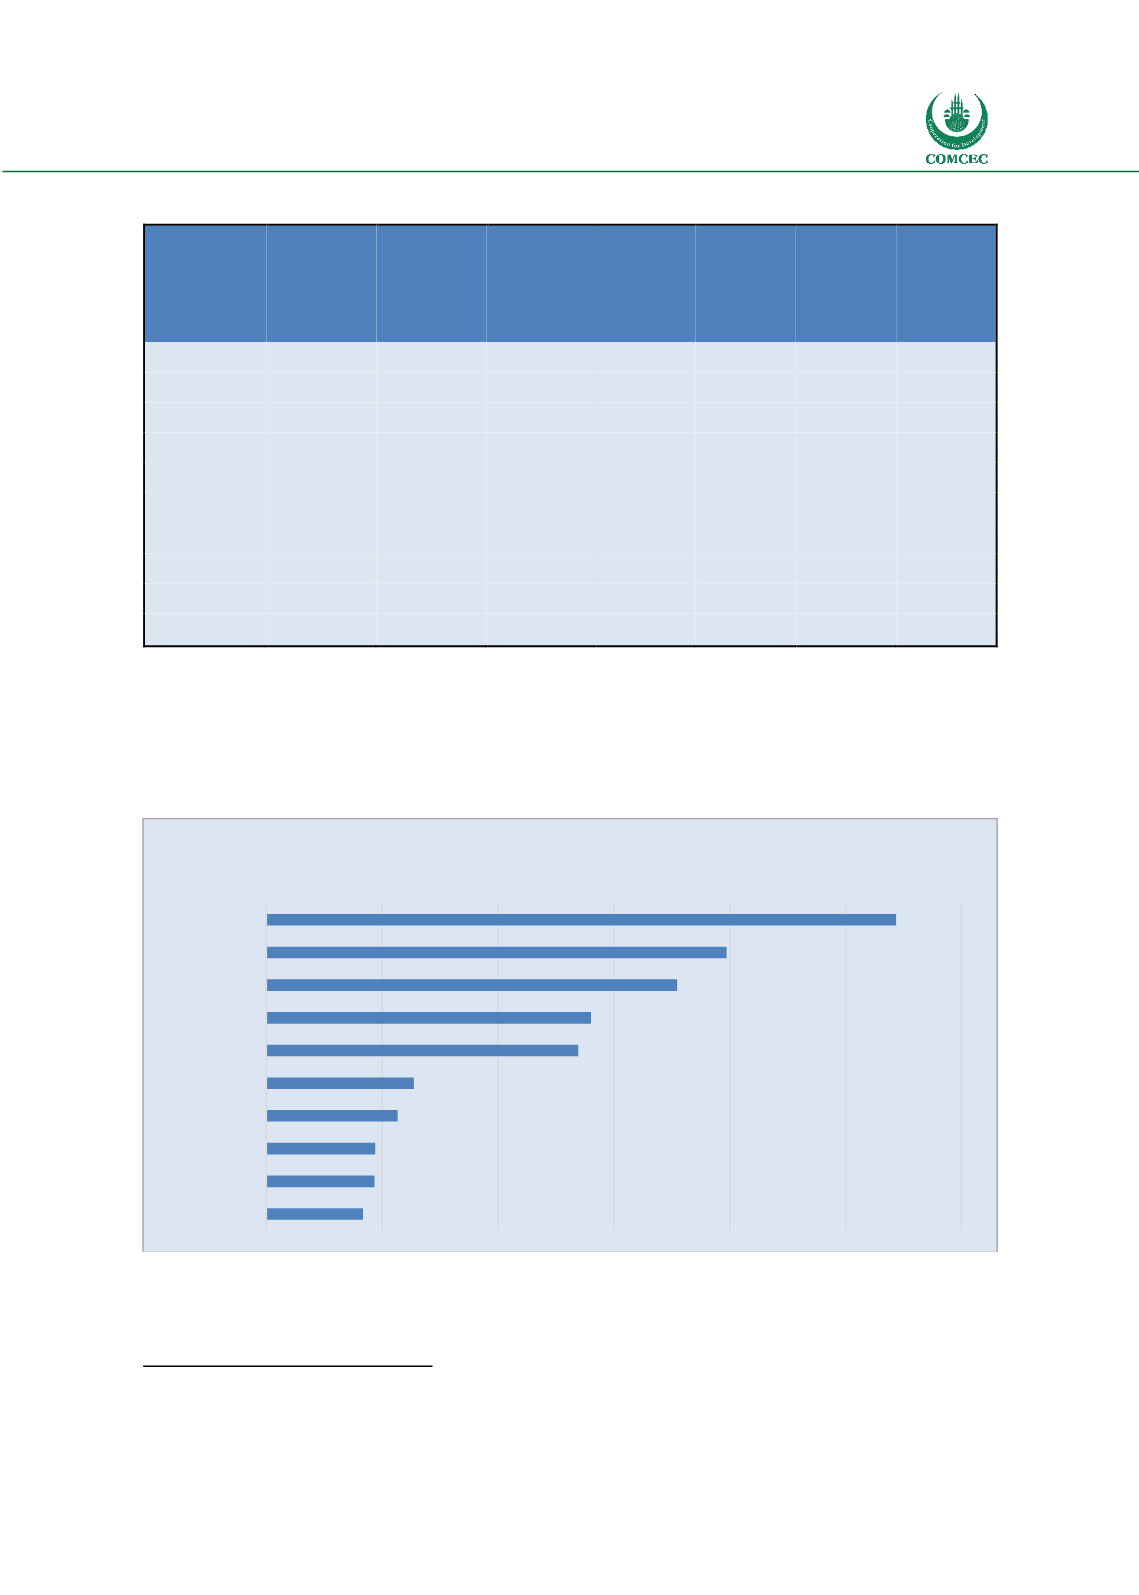
2.2.
MAIN CHARACTERISTICS OF TOTAL OIC IMPORTS
The leading five exporters in total OIC exports were at the same time the main importers.
Figure 21: OIC Imports fromWorld-2016
Source: IMF Direction of Trade Statistics
As in the case with total extra-OIC exports, total extra-OIC imports originated mainly from
developed countries except China. China was in the first place as 14.7 percent of extra-OIC
14
Classification of products by degree of manufacturing is available at UNCTADstat,
http://unctadstat.unctad.org/EN/Classifications.html0
50
100
150
200
250
300
UAE
Turkey
Malaysia
Saudi Arabia
Indonesia
Iran
Egypt
Pakistan
Algeria
Morocco
Billion Dollars