


 28 / 113

COMCEC Trade Outlook 2017
22
imports made from this country in 2016. Top ten countries accounted for almost half of total
extra-OIC imports in this year (Table 5).
Table 5: Major Countries of Origin of Total Extra-OIC Imports
(Billion Dollars)
Share %
Countries
2014
2015
2016
2014
2015
2016
China
270.1
242.1
232.7
14.0
14.2
14.7
United States
128.2
112.5
105.8
6.7
6.6
6.7
Germany
96.5
86.8
79.5
5.0
5.1
5.0
Japan
83.0
69.9
63.9
4.3
4.1
4.0
India
74.6
63.5
61.0
3.9
3.7
3.8
France
59.2
50.8
50.1
3.1
3.0
3.2
Korea
71.6
58.1
48.9
3.7
3.4
3.1
Italy
58.5
51.2
47.0
3.0
3.0
3.0
Russian Federation
72.0
56.9
46.3
3.7
3.3
2.9
Singapore
63.4
48.9
40.9
3.3
2.9
2.6
European Union
423.5
370.1
348.3
22.0
21.8
22.0
Total of Top Ten Countries
977.2
840.8
776.3
50.8
49.4
48.9
Source: IMF Direction of Trade Statistics
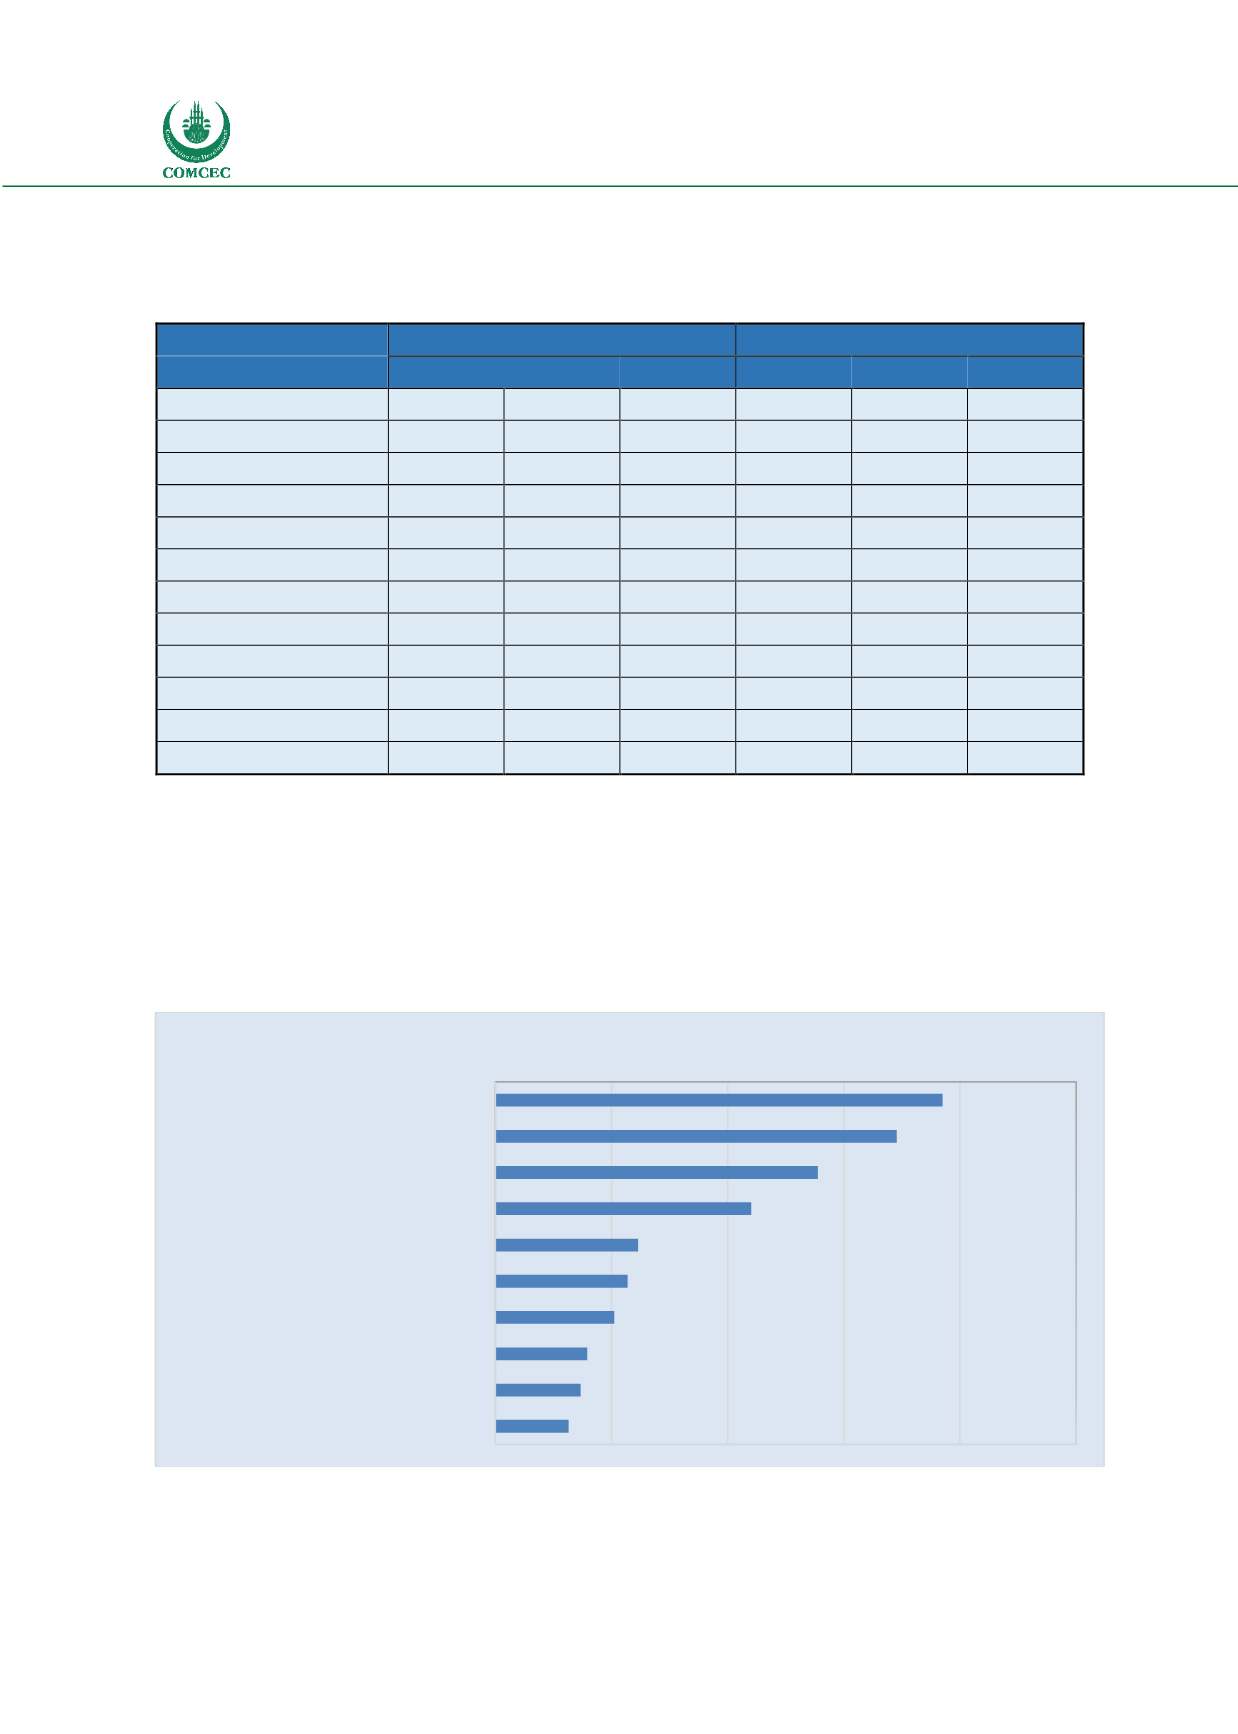
Total OIC imports is more diversified than the total OIC
exports in that manufactured items such as machinery,
nuclear reactors, boilers, electrical and electronic
equipment, vehicles other than railway, tramway, and
plastics also constitute an important part of total
imports.
Figure 22: OIC Imports fromWorld - Top 10 Items in 2016
Source: ITC Trade map
0
50
100
150
200
250
Machinery, mechanical appliances…
Electrical machinery and equipment …
Mineral fuels, mineral oils and products…
Vehicles other than railway or tramway…
Natural or cultured pearls, precious or semi-
precious stones…
Plastics and articles thereof
Iron and steel
Articles of iron or steel
Aircraft, spacecraft, and parts thereof
Pharmaceutical products
Billion Dollars
“The total OIC imports
is more diversified than
the total OIC exports”