


 29 / 113

COMCEC Trade Outlook 2017
23
3.
INTRA-OIC TRADE
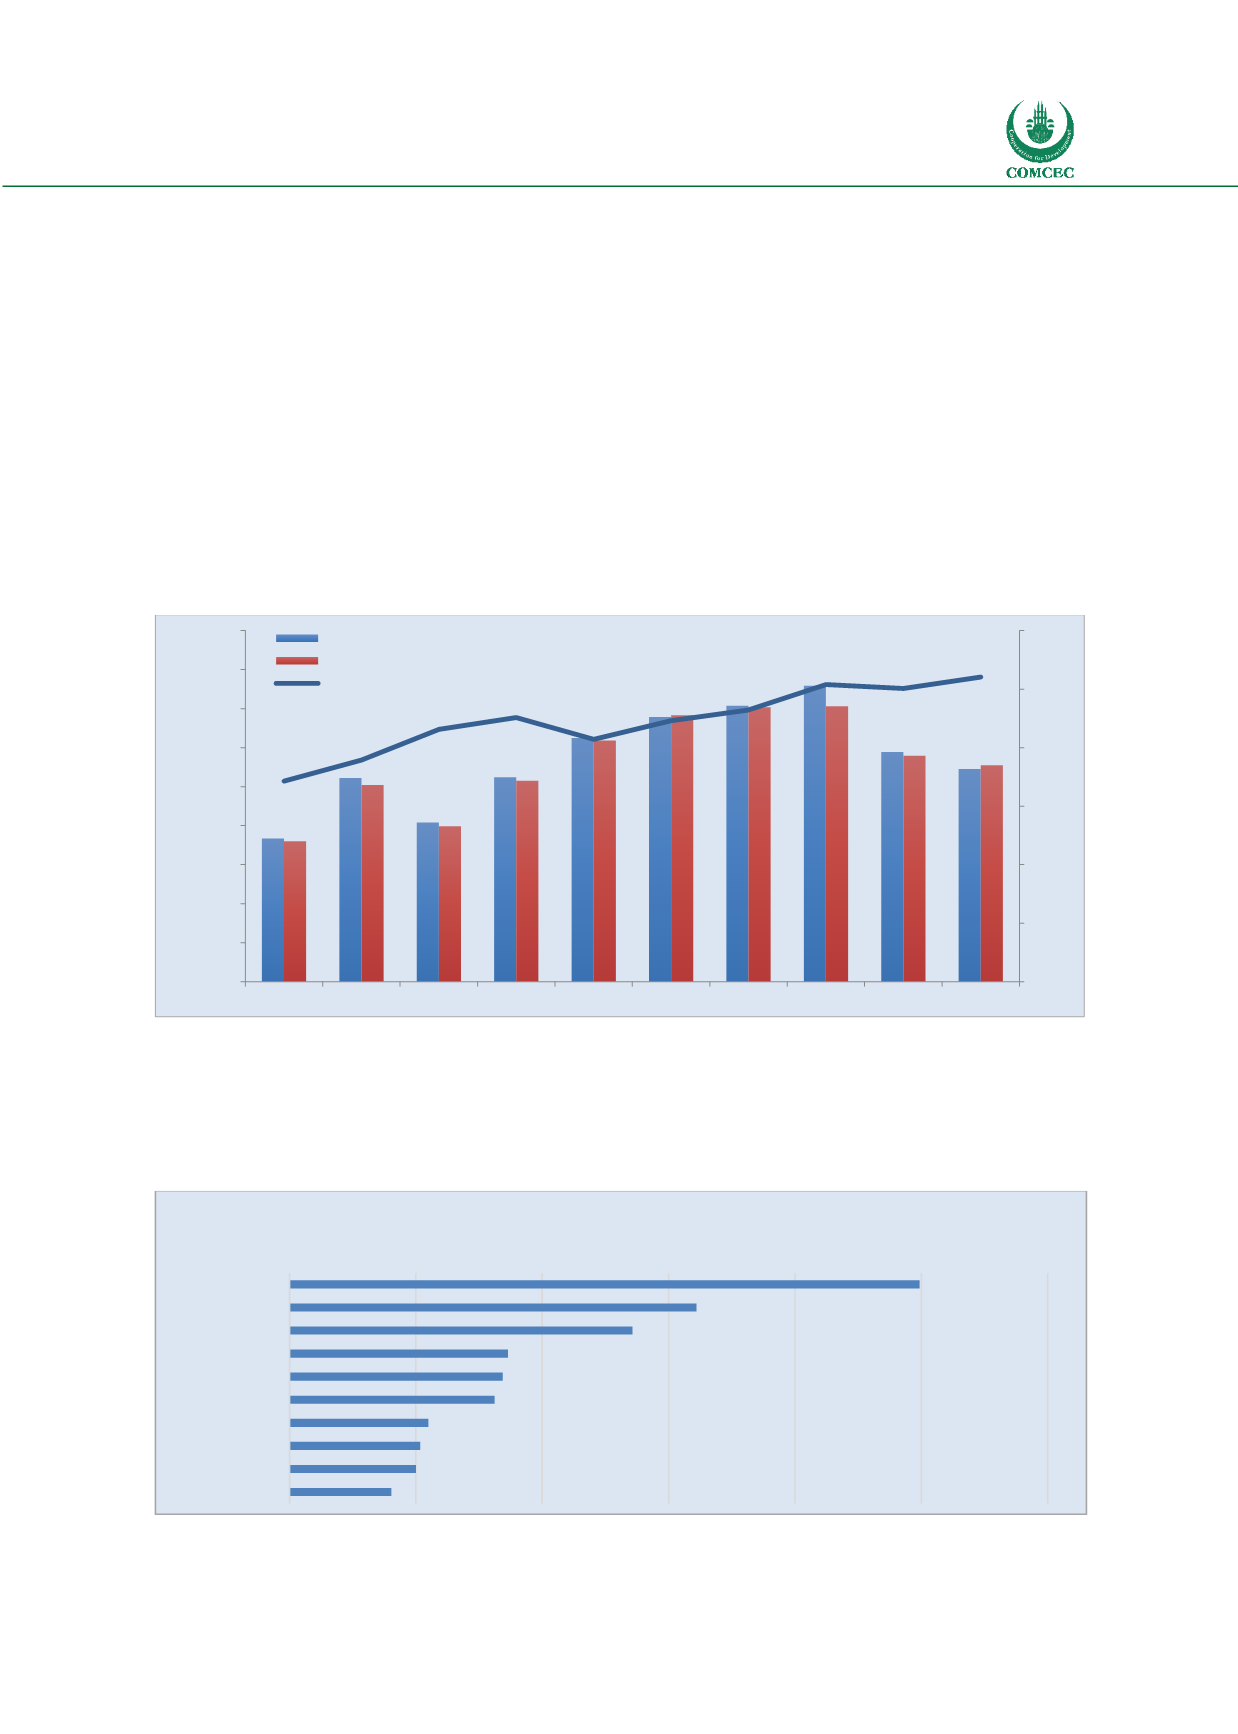
Although the intra-OIC trade (average of intra-OIC exports
and intra-OIC imports) peaked at 366 billion dollars in
2014, it has been declining since then. Intra-OIC trade fell
markedly by 20.2 per cent in 2015 and further declined by
5.8 per cent in 2016. Thus intra-OIC trade receded to 275
billion dollars in 2016 which was 91 billion dollars down
from its peak levels.
The share of intra-OIC trade in total trade peaked at 18.4 per cent in 2016. Intra-OIC exports
accounted for 19.7 percent of total OIC exports while intra OIC imports accounted for 17.3
percent of total OIC imports.
Figure 23: Evolution of the Intra-OIC Trade
Source: IMF Direction of Trade Statistics
Among the leading countries in intra-OIC trade in 2016, United Arab Emirates ranked first
followed by Turkey, Saudi Arabia, Malaysia and Indonesia. Top ten countries accounted for the
72.2 per cent of the intra-OIC trade.
Figure 24: Major Players in Intra-OIC Trade in 2016
Source: IMF Direction of Trade Statistics
8
10
12
14
16
18
20
0
50
100
150
200
250
300
350
400
450
2007
2008
2009
2010
2011
2012
2013
2014
2015
2016
Per cent
Billion $
Intra-OIC Merchandise Exports (Left Axis)
Intra-OIC Merchandise Imports (Left Axis)
Intra-OIC Trade Volume / Total Trade Volume (%)
100
64
54
35
34
32
22
21
20
16
0
20
40
60
80
100
120
UAE
Turkey
Saudi Arabia
Malaysia
Indonesia
Iran
Oman
Egypt
Pakistan
Qatar
Billion Dollars
“Share of Intra-OIC
trade in total OIC trade
peaked at 18.4 in 2016”