


 33 / 113

COMCEC Trade Outlook 2017
27
3.2.
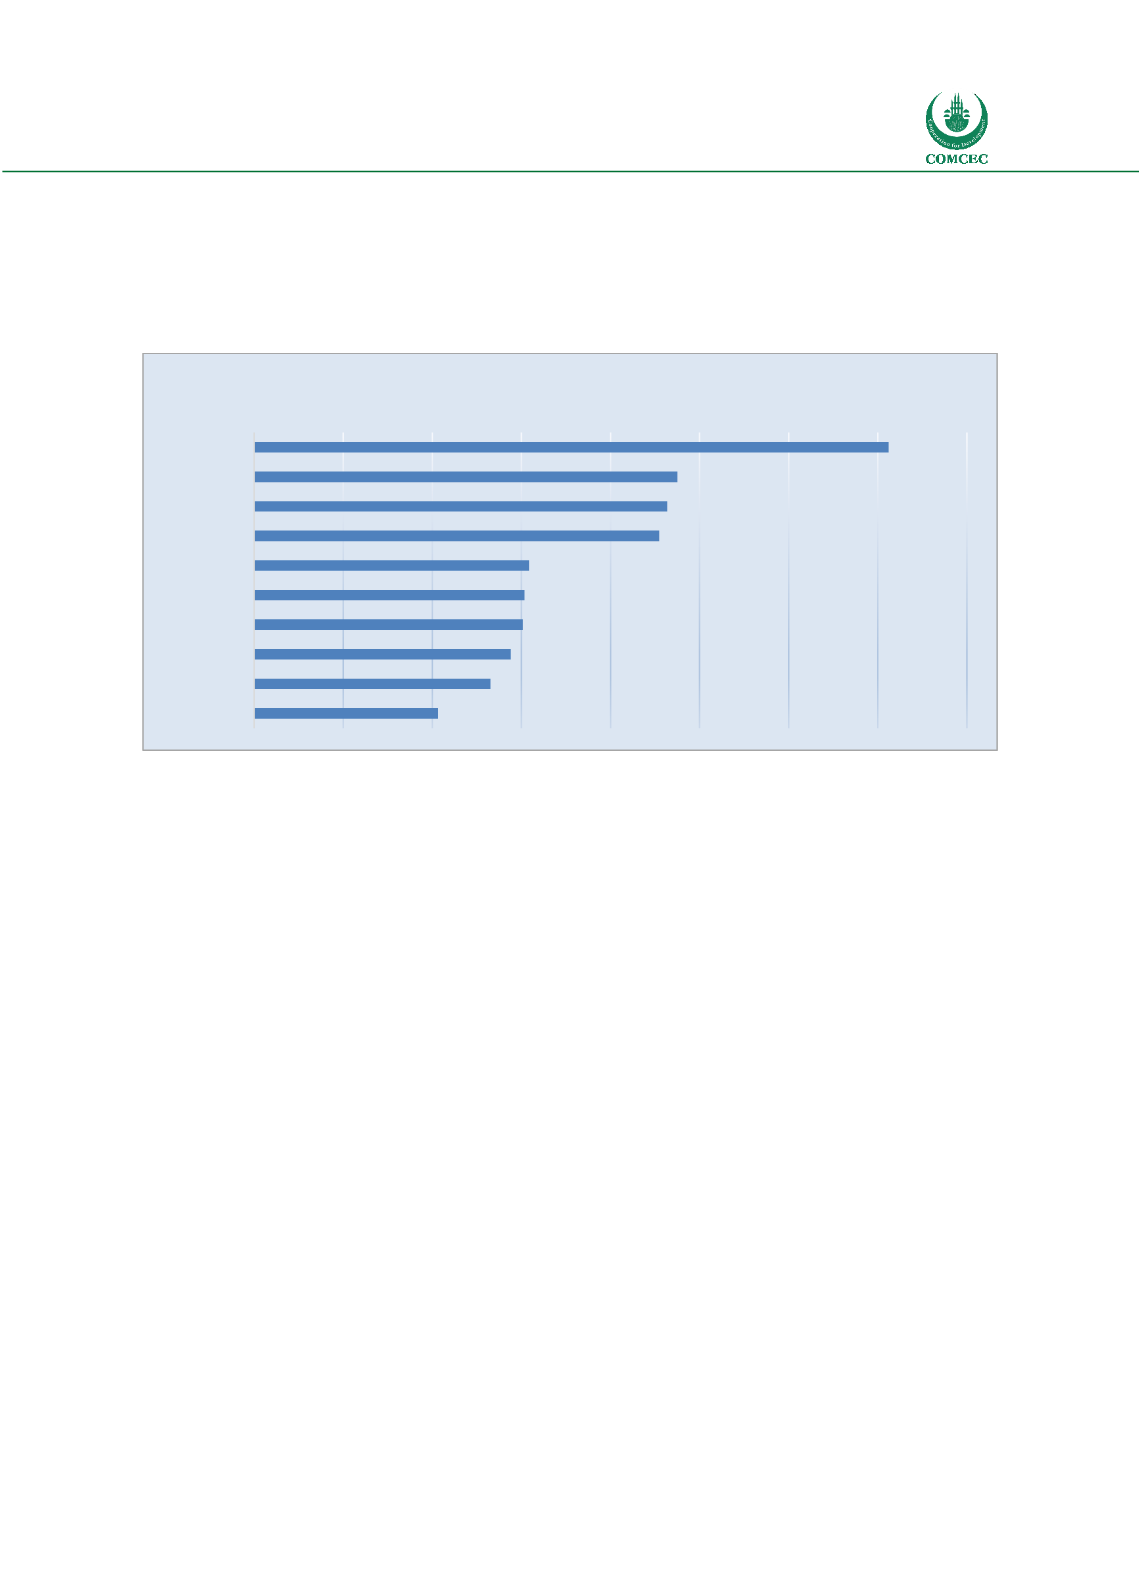
INTRA-OIC IMPORTS
The intra-OIC imports of UAE had the highest share in total intra OIC imports with 12.8 percent
followed by Iran (8.6 per cent) and Turkey with 8.3 per cent.
Figure 30: Intra OIC Imports in 2016
Source: IMF Direction of Trade Statistics
3.3.
INTRA TRADE BALANCE
Comparison of countries whether they are net intra-exporters or net intra-importers could
provide some insights. Since there is great variation in terms of absolute values of trade across
OIC countries, the ratio of intra exports to intra imports could be used in order to compare the
value of imports against exports. According to this ratio those countries with a value less than
100 per cent are net intra-importers (i.e. they import more goods from OIC than they export to
other OIC countries) while those with a value more than 100 per cent are net intra-exporters.
Figure 31 depicts that seventeen OIC countries have a ratio over 100 implying that they are net
intra exporters. Bahrain, which has the largest intra-trade surplus ranks first followed by
Kazakhstan, UAE and Turkey, Togo, Nigeria and Saudi Arabia. On the other hand 39 OIC
countries with a ratio below 100 are net intra importers. Among these net intra-importers
Maldives ranks first followed by Comoros, Yemen and Afghanistan.
36
24
23
23
15
15
15
14
13
10
0
5
10
15
20
25
30
35
40
UAE
Iran
Turkey
Saudi Arabia
Indonesia
Malaysia
Pakistan
Oman
Egypt
Iraq
Billion Dollars