


 38 / 113

COMCEC Trade Outlook 2017
32
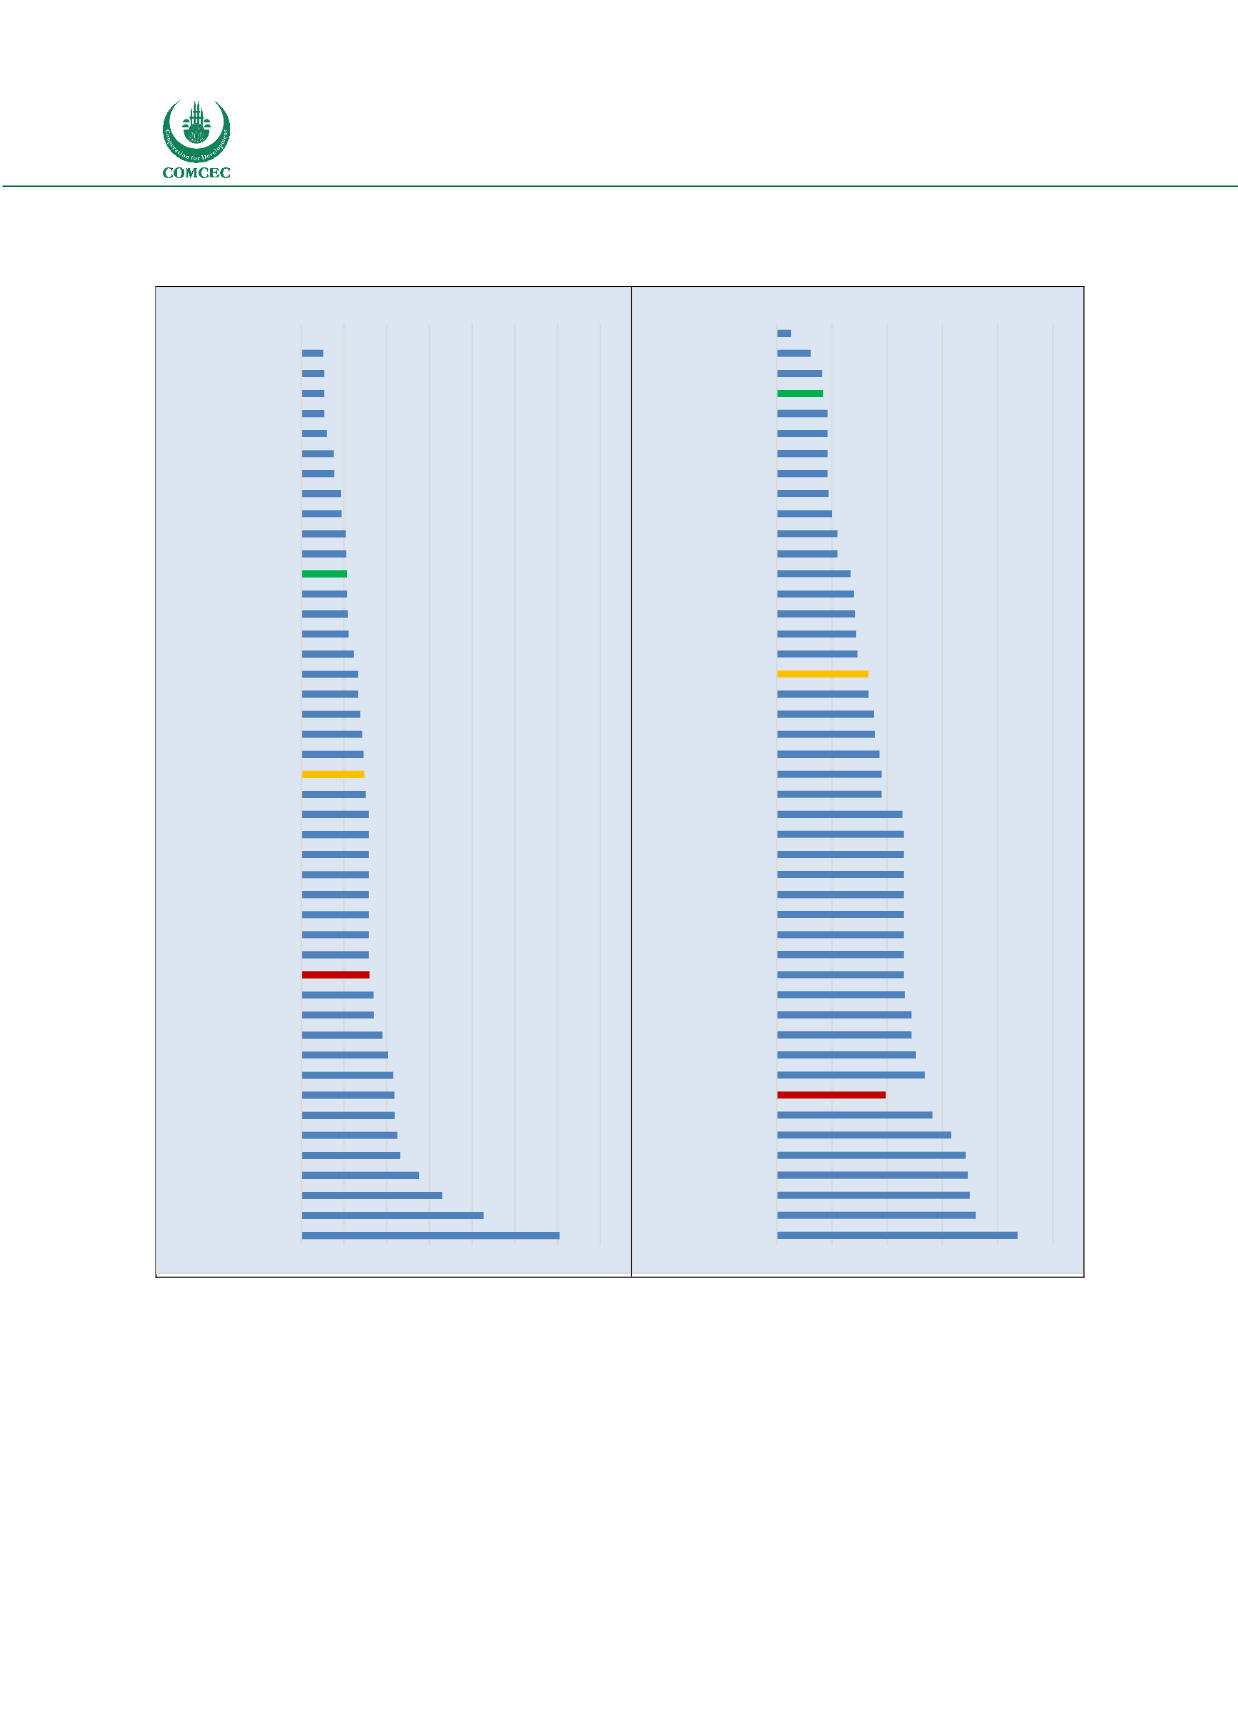
Source: WTO Tariff Profiles 2017 database Note: Includes countries where data is available
Trade Openness in the OIC
One of the most common measure of openness is to evaluate the ratio of trade (the sum of value
of exports and imports of goods) to the gross domestic product (GDP). This could be interpreted
as the relative importance of trade to the economy.
Figure 38 shows the difference between the trade to GDP ratios in percentage points between
2005 and 2016. As it could be observed from the Figure, the importance of trade has risen in
0
10 20 30 40 50 60 70
Brunei Darussalam
Kuwait
Bahrain
Qatar
UAE
Saudi Arabia
Indonesia
Albania
Kyrgyz Republic
Malaysia
Yemen
Tajikistan
European Union
Kazakhstan
Oman
Mauritania
Comoros
Azerbaijan
Pakistan
Mozambique
Djibouti
Guinea-Bissau
World Average
Lebanon
Benin
Burkina Faso
Côte d'Ivoire
Mali
Niger
Nigeria
Senegal
Togo
OIC Average
Bangladesh
Jordan
Uzbekistan
Uganda
Gabon
Guyana
Chad
Cameroon
Algeria
Morocco
Tunisia
Turkey
Egypt
0
5
10
15
20
25
Brunei Darussalam
Albania
Lebanon
European Union
Bahrain
Kuwait
Qatar
UAE
Oman
Saudi Arabia
Malaysia
Turkey
Indonesia
Yemen
Kyrgyz Republic
Tajikistan
Kazakhstan
World Average
Azerbaijan
Jordan
Morocco
Guyana
Egypt
Mozambique
Nigeria
Benin
Burkina Faso
Guinea-Bissau
Mali
Niger
Senegal
Togo
Uganda
Côte d'Ivoire
Mauritania
Pakistan
Tunisia
Bangladesh
OIC Average
Uzbekistan
Comoros
Gabon
Chad
Cameroon
Algeria
Djibouti
Figure 36: Simple Average Applied Tariffs on
Agricultural Products in OIC Countries-2015
Figure 37: Simple Average Applied Tariffs on Non-
Agricultural Products in OIC Countries-
2015