


 36 / 113

COMCEC Trade Outlook 2017
30
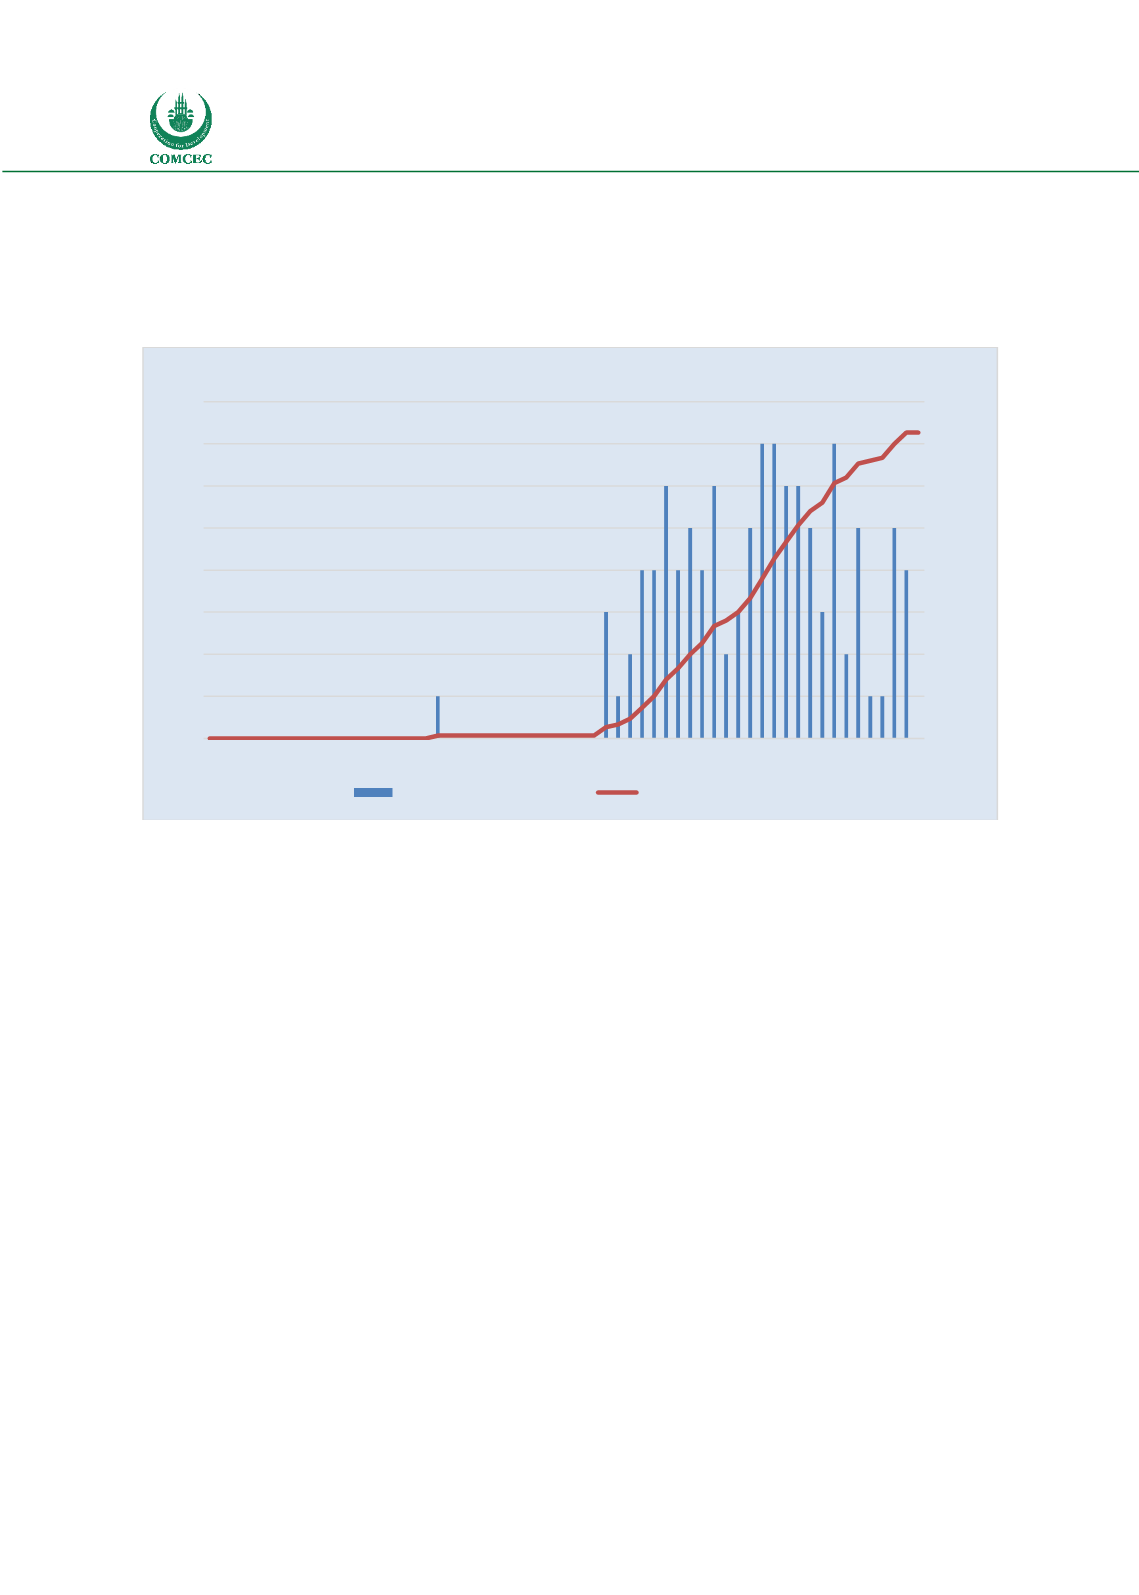
Most of the OIC Member States also took part in one or more RTAs over time. The number of
RTAs, which include one or more OIC Member States, has reached 109 by September 2017. Most
of these RTAs are in the form of FTAs. Most of the RTAs signed by the OIC Member States are
bilateral and concluded with the developed countries.
Figure 33: Number of RTAs including one or more OIC Member States
Source: WTO
http://rtais.wto.org/UI/PublicAllRTAList.aspxThere are also other approaches for liberalizing
trade. Some of the countries which realized that
freer trade boosts economic growth also
liberalized their trade unilaterally especially the
ones who previously experienced the generation
of exports from a less restricted trade. Many
countries have diversified their economies and enriched the goods subject to export in their
countries. To export, countries do not need to produce all the inputs within their borders any
more. Imported inputs which are cheaper than domestically produced ones are used by the
firms to compete in export markets. For example Nordas, Groli and Grosso (2006) state that in
2001 the import content of export value in the electronics sector was 32% in China, 55% in
Ireland, 65% in Thailand and 72% in the Philippines. In many cases countries apply lower tariffs
to these kinds of goods.
Application of high tariff rates is common in many OIC Member States. Countries apply high
tariffs for various reasons such as protecting domestic industry, preventing unemployment,
providing government revenue through customs duties etc. Figure 34 illustrates the highest
simple average tariff-applying WTO Members. As shown in the figure, 10 out of these 20
countries are OIC countries.
0
20
40
60
80
100
120
0
1
2
3
4
5
6
7
8
1958
1960
1962
1964
1966
1968
1970
1972
1974
1976
1978
1980
1982
1984
1986
1988
1990
1992
1994
1996
1998
2000
2002
2004
2006
2008
2010
2012
2014
2016
Total Number of RTAs
Annual Number of RTAs
Annual Number RTA's
Total Number RTA's
“
Many OIC countries
apply higher tariffs than
the WTO average
”