


 31 / 113

COMCEC Trade Outlook 2017
25
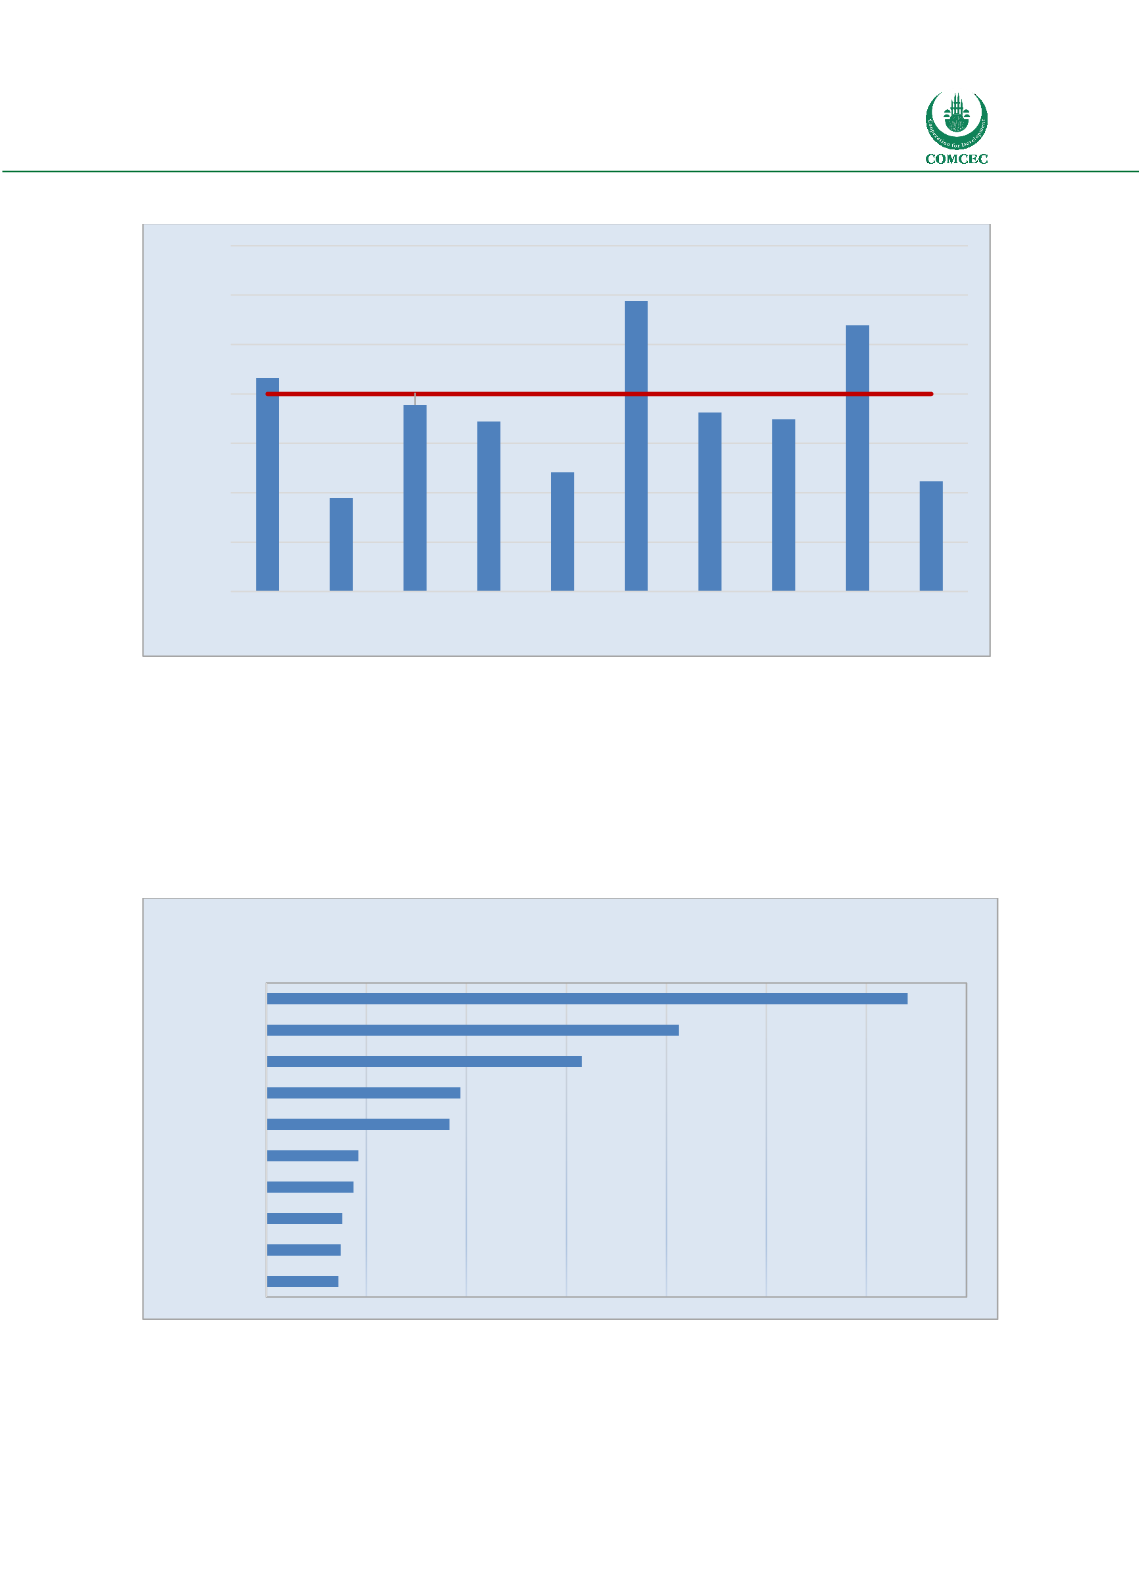
Figure 27: Intra-OIC Trade Shares of Top OIC Traders* (2016)
Source: IMF Direction of Trade Statistics (*): Countries are ranked based on their share in total OIC trade.
3.1.
INTRA-OIC EXPORTS
The United Arab Emirates took the lead in intra-OIC exports in 2016 by realizing 23.5 percent
of the total intra-OIC exports and was followed by Turkey (15.1 per cent) and by Saudi Arabia
11.6 per cent). These three countries as a whole accounts for half of intra-OIC exports.
Figure 28: Intra-OIC Exports in 2016
Source: IMF Direction of Trade statistics
Although the sectorial breakdown of intra-OIC exports is similar to that of total OIC exports
being dominated by mineral fuels, its share is not as high as in total exports (Figure 29). Of the
21.6
9.5
18.9
17.2
12.1
29.4
18.1 17.5
27.0
11.2
0
5
10
15
20
25
30
35
UAE Malaysia Turkey Saudi
Arabia
Indonesia Iran Qatar
Iraq Egypt Algeria
Per cent
64
41
32
19
18
9
9
8
7
7
0
10
20
30
40
50
60
70
UAE
Turkey
Saudi Arabia
Malaysia
Indonesia
Qatar
Iran
Oman
Egypt
Bahrain
Billion Dollars