
COMCEC Trade Outlook 2016
8
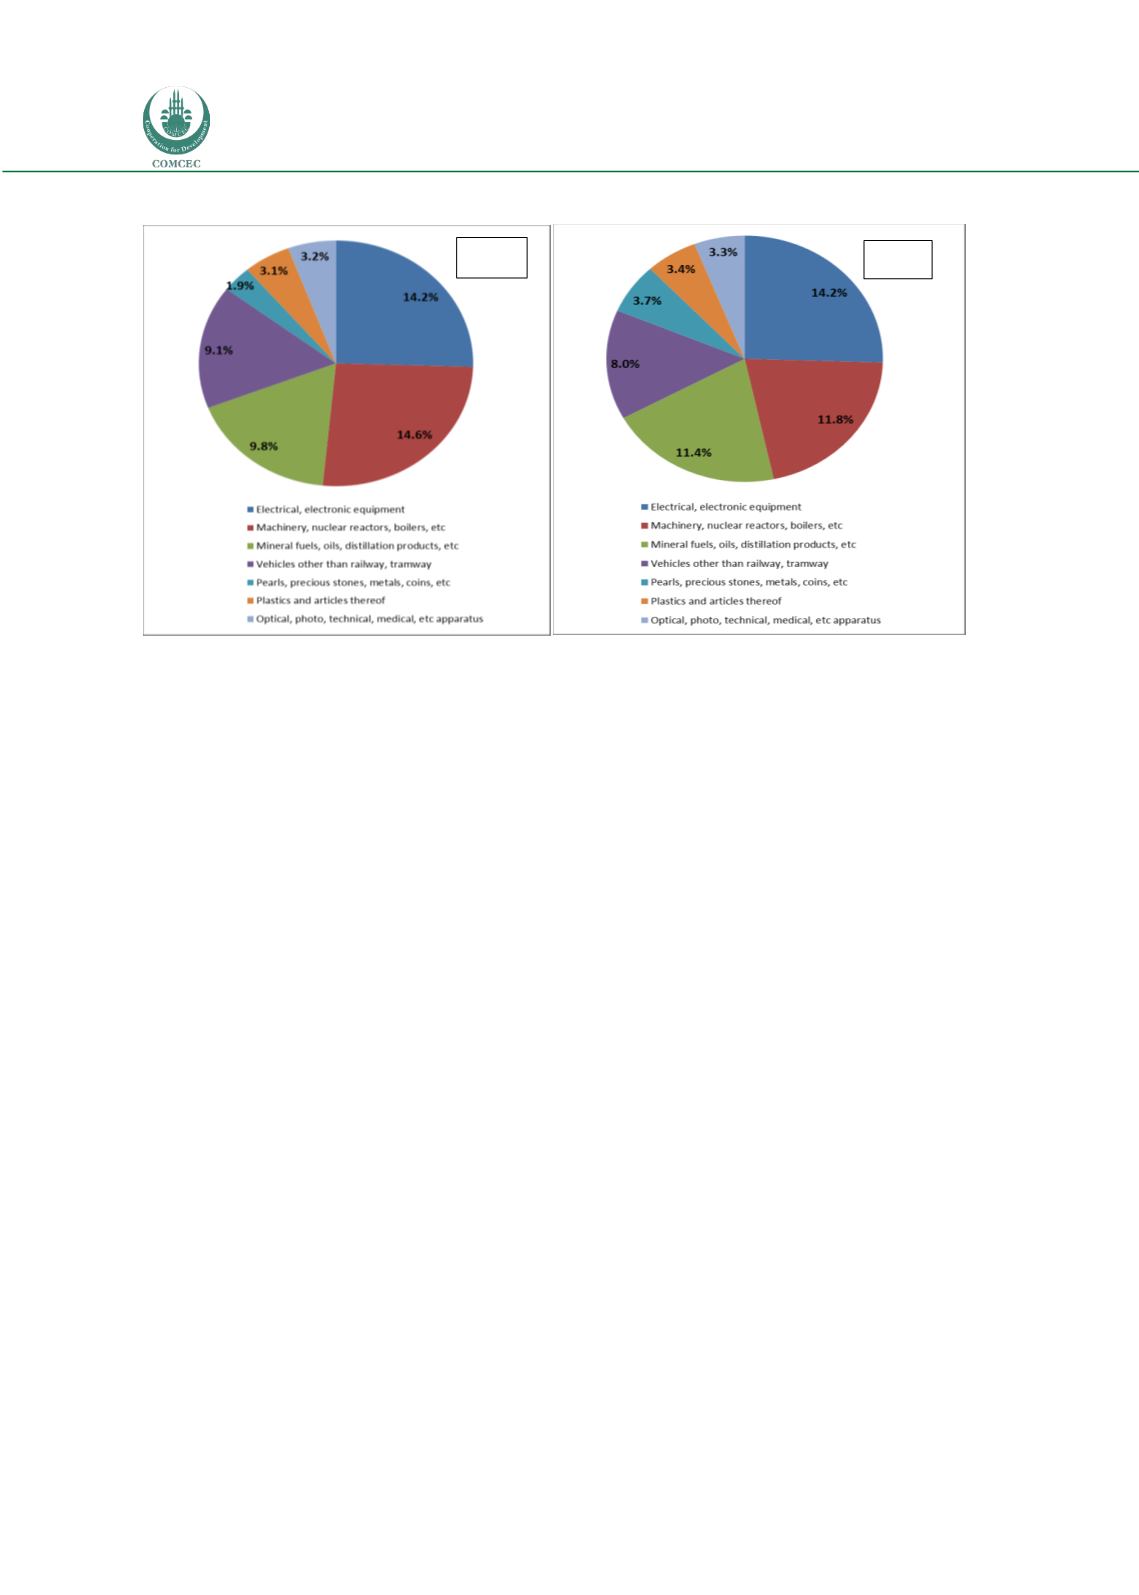
Figure 6: World Exports by Sectors
Source: ITC Trademap
Secondmajor pattern shaping the world trade was the fragmentation of global productionwhich
mainly led by the technological innovations in communication and transportation. These in turn
by lowering trade costs enabled countries to specialize in production of specific tasks or
components instead of entire final products. According to WTO (2014) almost half of the world’s
gross exports are based on global value chains (GVCs). Developing countries’ participation in
GVCs has significantly increased over the past decade as more than half of developing country
exports in value-added terms involve global value chains. Moreover GVC based trade among
developing countries also increased as reflected in the fourfold rise in the share of trade in parts
and components in total trade between developing countries between 1988 and 2013.
The rising share of developing economies in world trade was the third dominant pattern in the
world trade. The share of developing countries in global trade increased steadily. Their share in
world exports increased from 32.7 percent in 2001 to 47.8 percent in 2015. This increase was
mainly led by the exports of Brazil, Russia, India and China (BRIC) and other Asian developing
countries. The BRIC countries’ share in world exports reached from 7.7 per cent in 2001 to 18.9
percent in 2015. The developing countries as a group have increased their share in world
imports from 29.5 percent in 2001 to 44.6 percent in 2015. From 2001 to 2015, the BRIC
countries’ combined share of total world imports rose from 6.2 to 14.7 percent. China alone
contributed 10.2 per cent of the BRIC countries’ share of world imports in 2015.
2001
2001
2015


