


 12 / 62

COMCEC Trade Outlook 2016
6
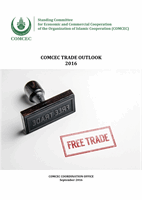
Figure 3: Evolution of the Prices of Selected Commodities (2005=100)
Source: IMF
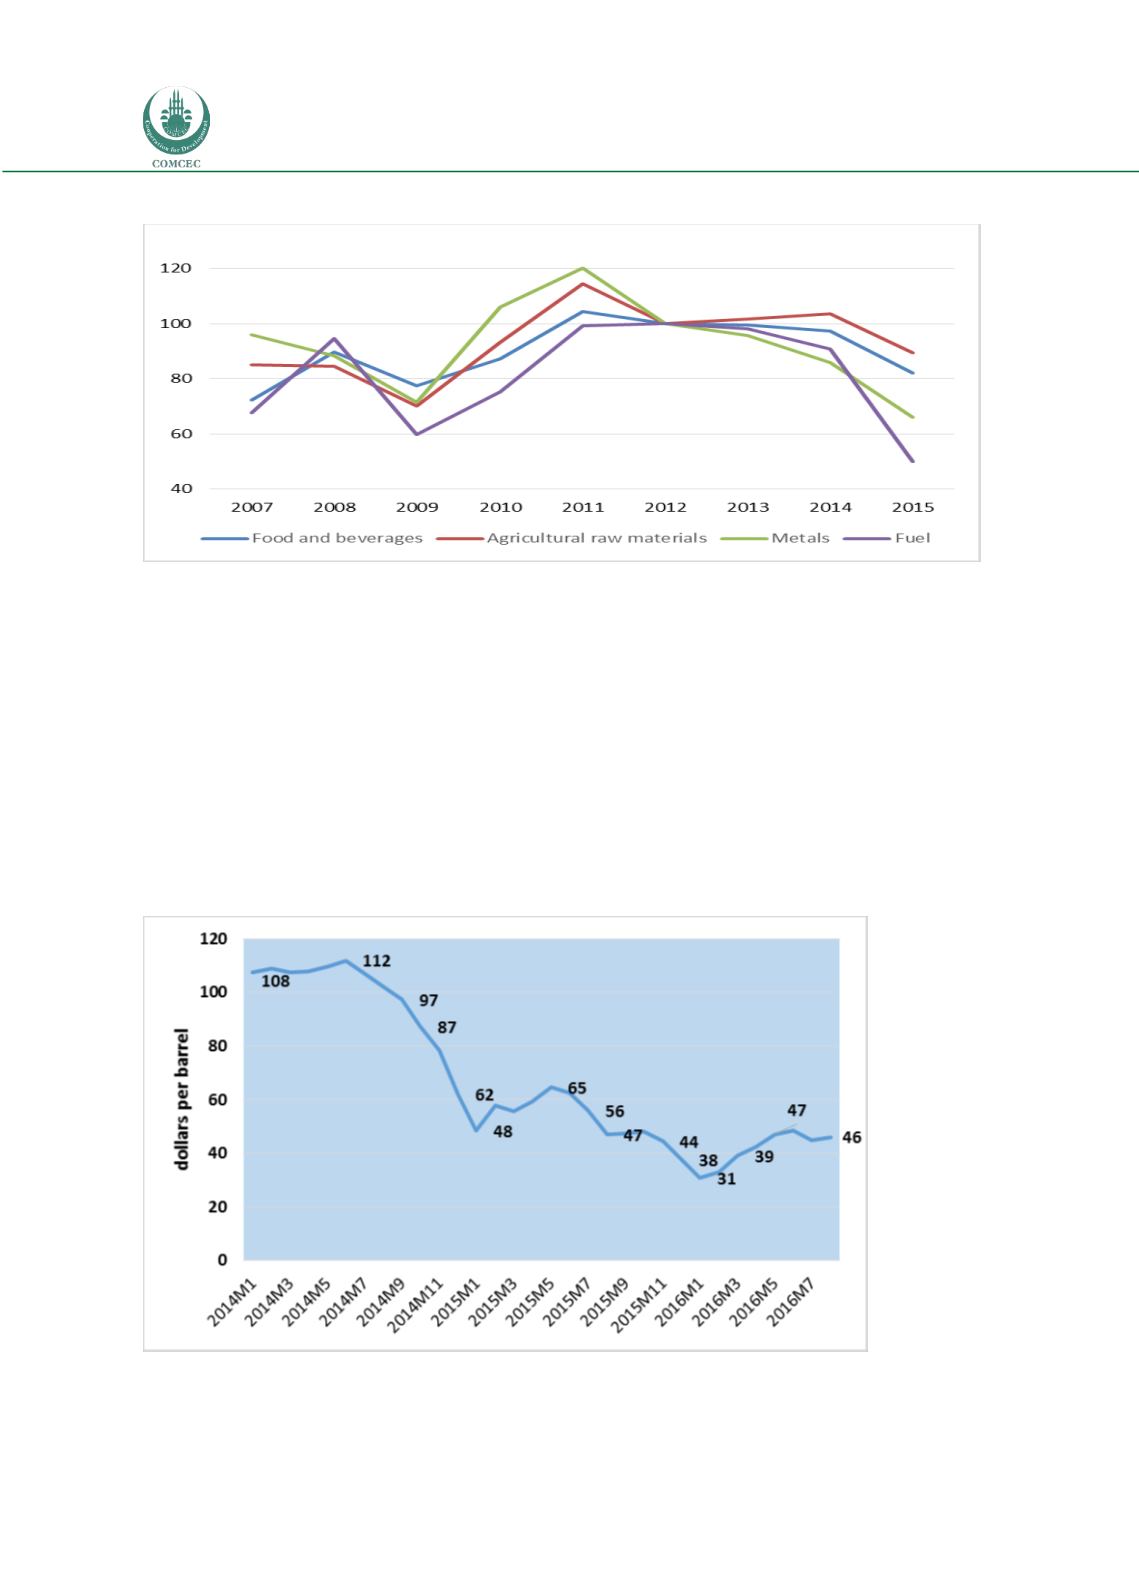
The crude oil (Brent) price which was 25.0 dollars per barrel in 2002 increased steadily and
reached 97.7 dollars per barrel prior to the global crisis. After falling sharply in 2009, oil prices
started to increase and peaked at 112.0 dollars per barrel in 2012 due to mainly political
instability in the Middle East. Brent oil prices remained relatively stable and averaged 111
dollars per barrel between 2011 and 2013. However oil prices have declined sharply since June
2014. Thus Brent crude oil prices averaged 38 dollars per barrel in December 2015, which was
the lowest monthly average price since June 2004. Thus the oil prices declined on average 47
per cent in 2015 (see Figure 4). Although oil prices further declined to 31 dollars per barrel on
January 2016, they increased in the following months and averaged 46 dollars per barrel in
August 2016.
Figure 4: Monthly Oil Prices
Source: IMF Commodity Price Statistics