
COMCEC Trade Outlook 2016
13
Prices of commodities, in particular fuels, declined sharply starting from June 2014. Brent oil
prices declined by almost 50 percent from98.9 dollar per barrel in 2014 to 52.4 dollar per barrel
2015. As a result, energy exporters of OIC were affected severely by this commodity price
decline. (WB 2016)
Table 2 shows the sectors which have the largest negative impact on the percentage fall of the
total OIC exports in 2015 in descending order. Mineral fuels and oils were accounted for 64 per
cent of the decline in total OIC exports.
Table 2: Sectoral Contributions to Change in Total OIC Exports
Source
:
ITC Trademap
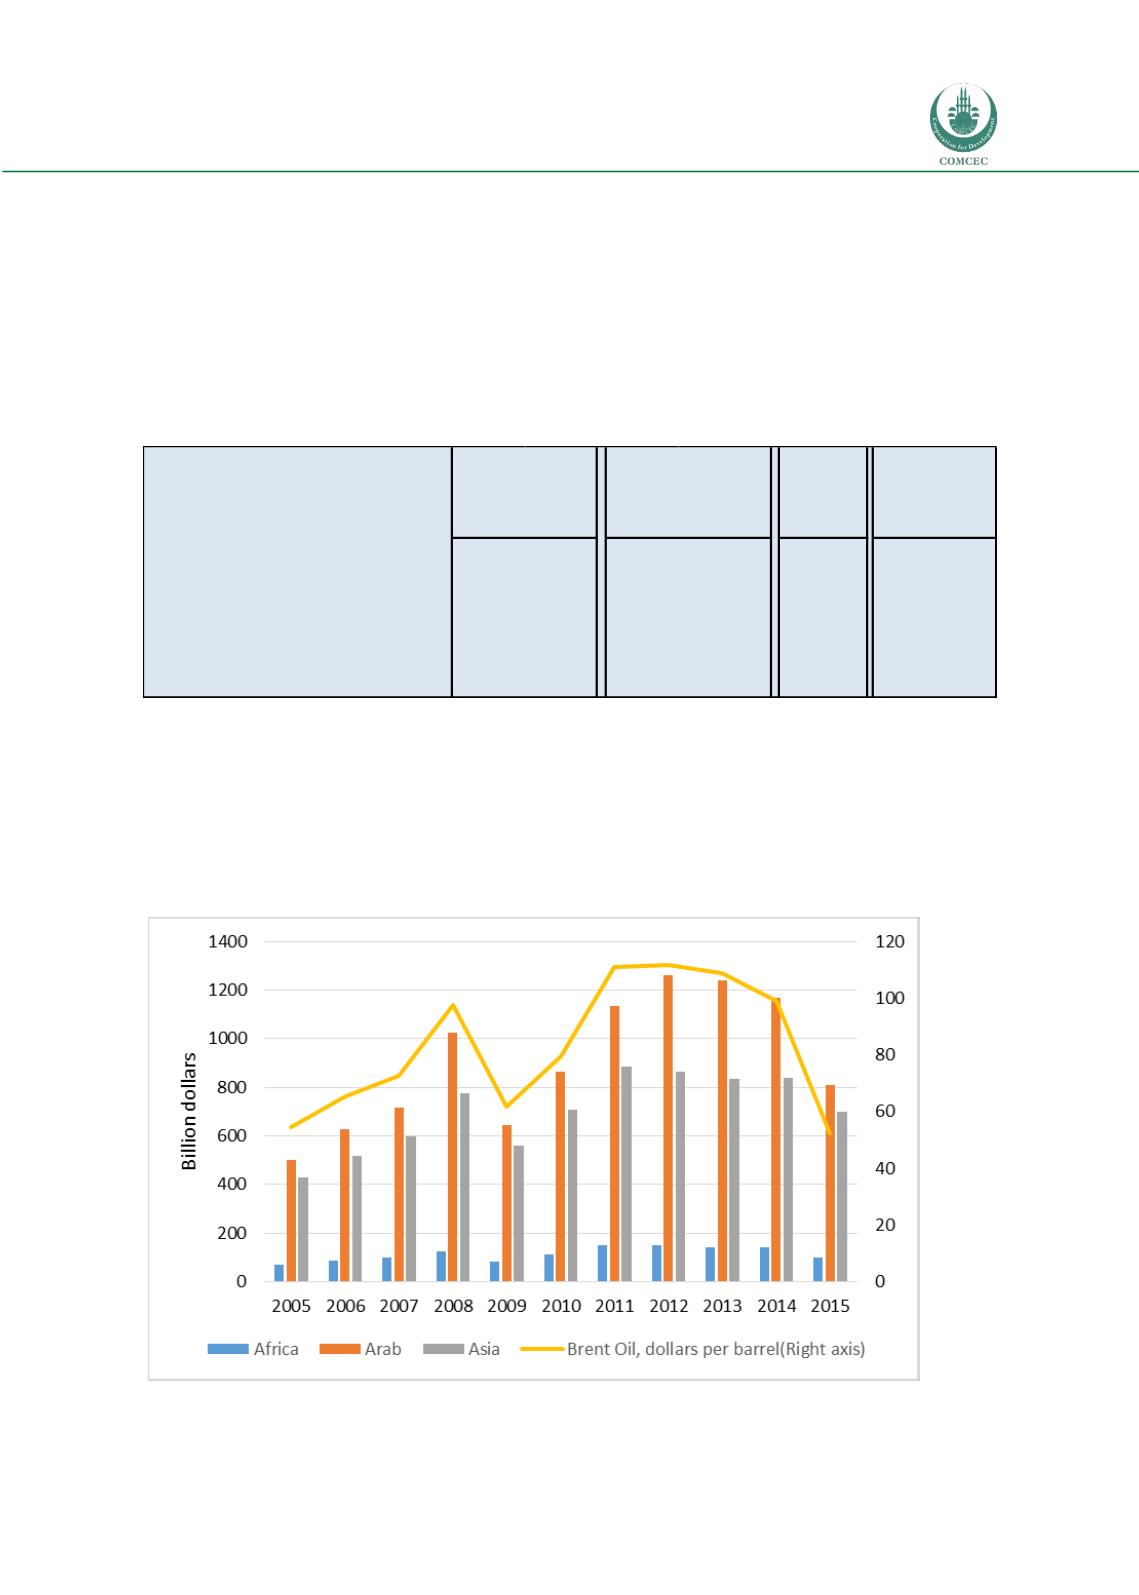
Figure 10 shows the evolution of total OIC exports by region versus oil price developments.
Although both Arab region and Asian region exports move in tandem with oil prices, as Arab
regions exports is heavily dominated by mineral fuels there is a high correlation between the
Arab region’s exports and the oil price developments. The collapse in Arab region’s exports in
2015 was mostly attributable to recent oil price slump.
Figure 10: Evolution of the Value of Total OIC Exports by Region versus Oil prices
Source: IMF
Per Cent
Change
Contribution to
Change in Total
OIC Exports (%)
2014 2015
2014
2015
2015/2014 2015/2014
Mineral fuels, oils, distillation products, etc
53.3
47.5
1,215
699
-42.4
-22.6
Commodities not elsewhere specified
5.1
0.3
115
4
-96.7
-4.9
Electrical, electronic equipment
5.7
6.3
130
92
-28.9
-1.6
Machinery, nuclear reactors, boilers, etc
3.1
3.4
72
50
-30.4
-1.0
Pearls, precious stones, metals, coins, etc
3.2
3.8
72
56
-22.6
-0.7
Vehicles other than railway, tramway
2.1
2.5
49
37
-25.4
-0.5
Plastics and articles thereof
2.4
3.1
55
45
-16.9
-0.4
Per cent Share in
Total OIC Exports
Exports(billion dollars)


