


 11 / 133

COMCEC Trade Outlook 2018
3
1.
DEVELOPMENTS IN GLOBAL MERCHANDISE TRADE
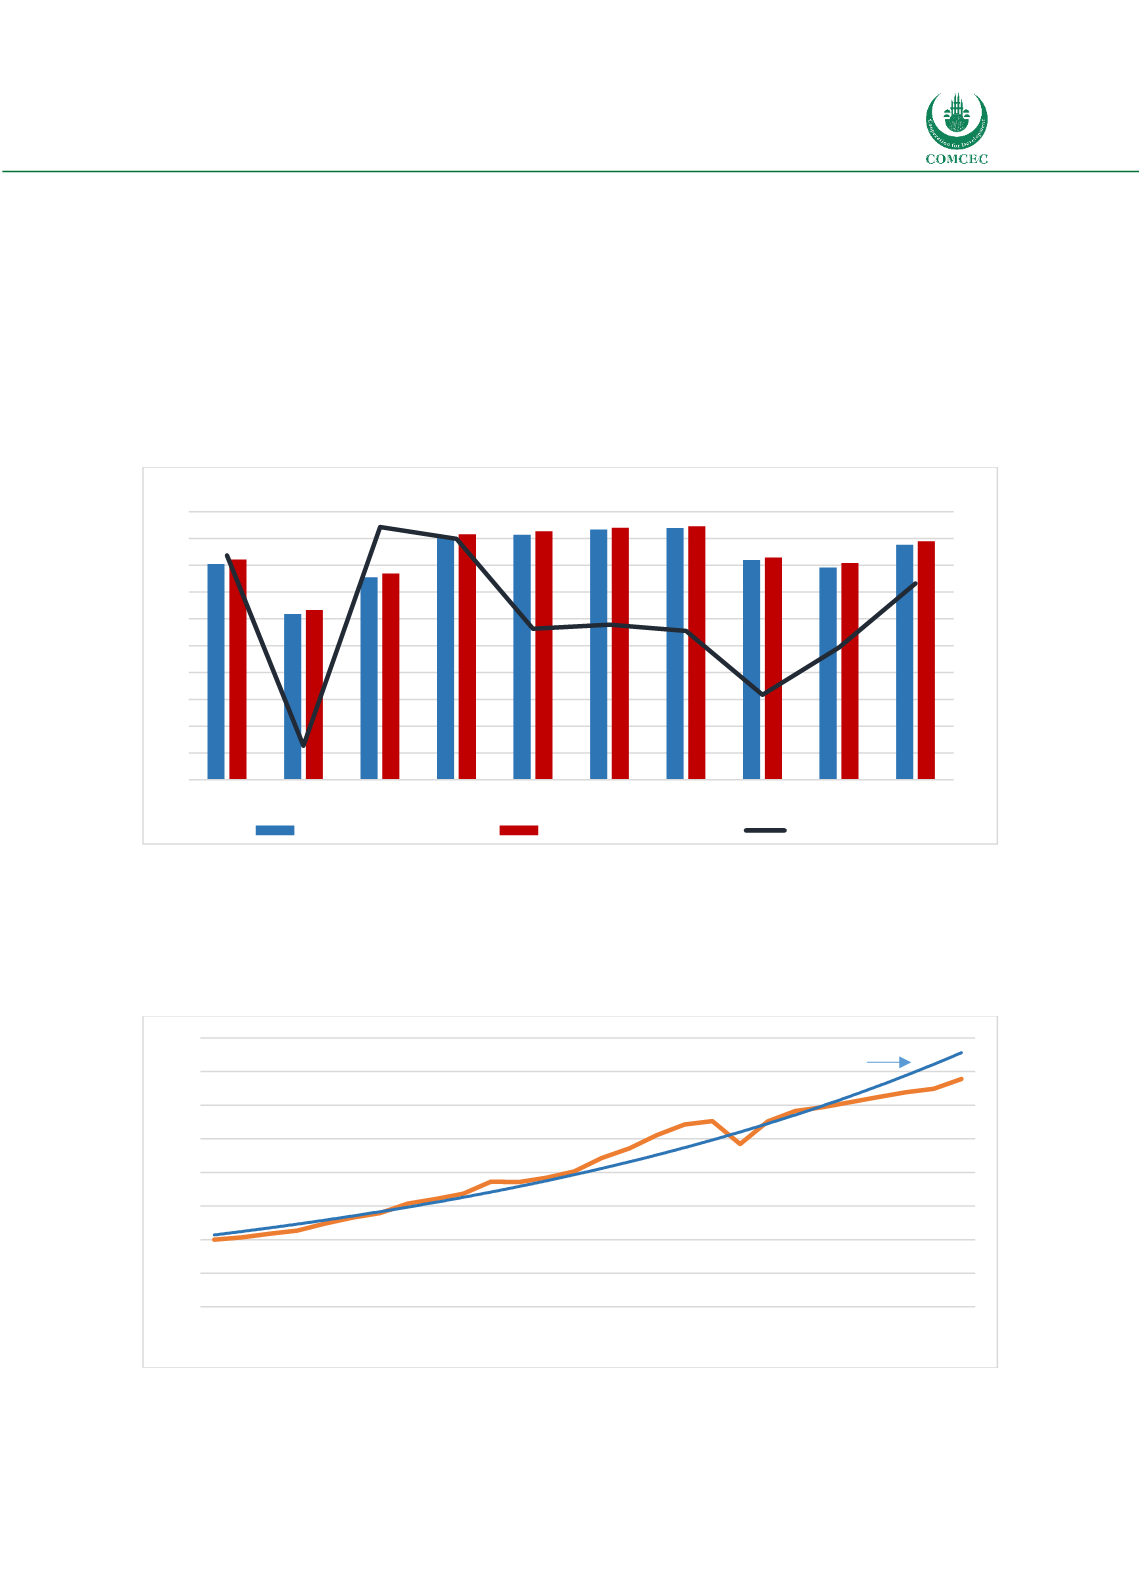
World merchandise trade as measured by the average of world exports and world imports (in
current US dollars) grew at an annual average rate of 12.2 per cent between 2000 and 2008
period. After contracting sharply in 2009 due to global crisis, word trade rebounded rapidly in
2011, but remained weak between 2012 and 2016 period. However, 2017 marked the first year
that the world trade increased significantly both in value and volume terms since the global
crisis. Thus, world trade increased by 10.3 per cent in 2017 to 17.7 trillion US dollars up from
16.0 trillion US dollars in 2016.
Figure 1: Global Trade in the Last Decade
Source: IMF Direction of Trade Statistics
In 2017 growth in world trade volume (accounted for changes in prices and exchange rates) was
the highest achieved since 2011. Thus world trade volume increased to 4.7 per cent in 2017
from 1.8 per cent in 2016. This pointed to a 2.4 percentage points higher growth rate compared
to the average growth rate of previous three years.
Figure 2: World Export Volume
Source: WTO
16.1
-23.0
21.9
19.4
1.0
1.9
0.6
-12.6
-2.9
10.3
-30
-25
-20
-15
-10
-5
0
5
10
15
20
25
0
2
4
6
8
10
12
14
16
18
20
2008 2009 2010 2011 2012 2013 2014 2015 2016 2017
Trillion USD
Percent
World Export
World Import
Annual Growth
0
50
100
150
200
250
300
350
400
1990
1991
1992
1993
1994
1995
1996
1997
1998
1999
2000
2001
2002
2003
2004
2005
2006
2007
2008
2009
2010
2011
2012
2013
2014
2015
2016
2017
Trend