


 29 / 101

COMCEC Agriculture Outlook 2016
18
In 2013, the share of OIC Member Countries in the world fruit production accounted for
18.6 percent, slightly decreasing from 19.1 percent in 2000. On the contrary, the share of the
OIC Member Countries in the world total production of vegetables increased from 14.5 percent
in 2000 to 14.9 percent in 2013.
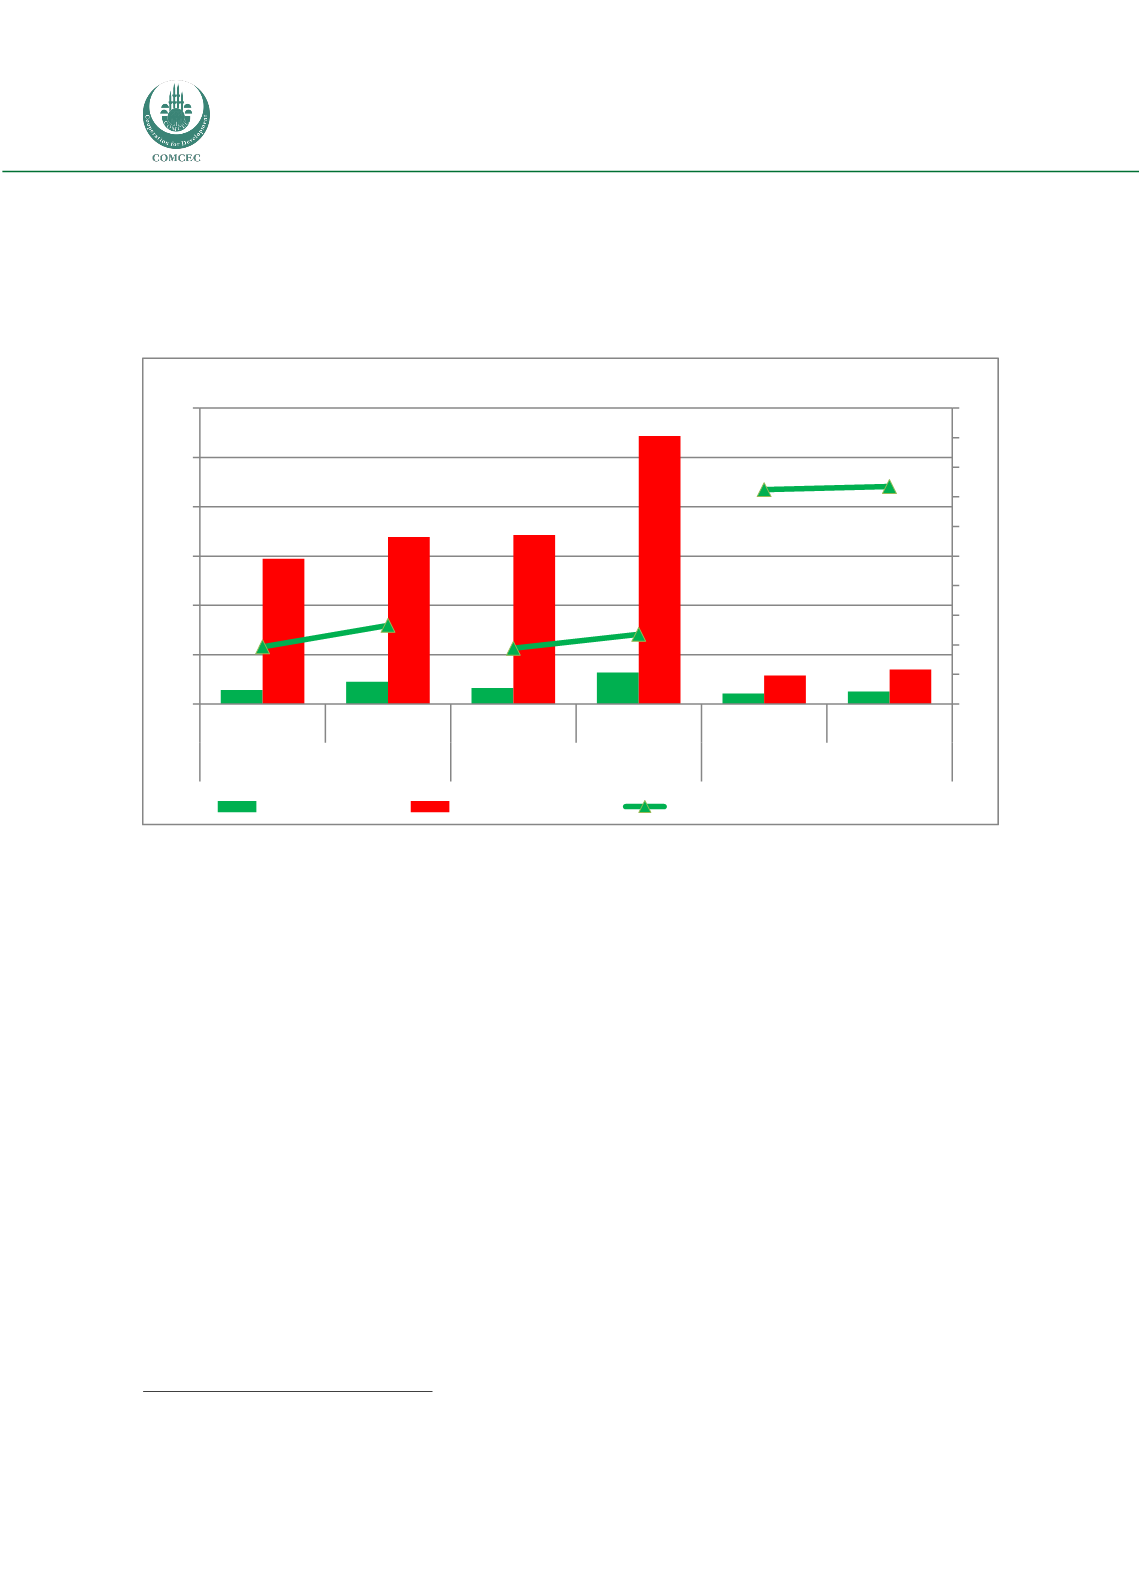
Figure 13. Meat Production in the OIC and its Share in the World
Source: Calculated by Using FAO online databases, 2015
Figure 13 illustrates the developments in meat production in the OIC Member Countries
and its share in the world. In 2013, 9.7 million tons of beef and buffalo meat was produced in
the OIC while it was 5.7 million in 2000. This noteworthy increase in beef and buffalo meat
production was mainly due to the supply-side factors, such as cheap inputs, technological
change and scale efficiency gains in the last decade.
9
Furthermore, the significant shift in beef
and buffalo meat production also leads to an increase in the share of OIC in the world’s
production. Hence, the contribution of OIC Member Countries’ beef and buffalo meat
production to the world’s beef and buffalo meat production rose to 13.3 percent in 2013, while
it was 9.7 percent in 2000.
Correspondingly, a dramatic surge is observed in the poultry meat production during
the same period. While it was 6.5 million tons in the beginning of the century, it has almost
doubled and realized as 12.8 million tons in 2013. Nonetheless, the increase in the share of OIC
poultry meat production in the world occurred moderately due to the high rate of growth in
poultry sector across the globe. Thus, the contribution of OIC Member Countries’ meat poultry
production to the world’s poultry meat production slightly ascended to 11.8 percent in 2013,
while it was 9.4 in 2000. Lastly, sheep and goat meat production of OIC Member Countries
continued to grow and exceeded to 5 million tons in 2013. Compared to beef and buffalo meat
9
SESRIC, 2015
5,7
9,0
6,5
12,8
4,2
5,1
58,9
67.9
68,6
108,7
11,5
14.1
9,7
13,3
9,4
11,8
36,2
36.3
0
5
10
15
20
25
30
35
40
45
50
0
20
40
60
80
100
120
2000
2013
2000
2013
2000
2013
Beef and Buffalo Meat
Poultry Meat
Sheep and Goat Meat
Million Tons
Percent
OIC (Left Axis)
World (Left Axis)
OIC Share in the World (Right Axis)