


 31 / 101

COMCEC Agriculture Outlook 2016
20
In 2013, average agricultural land productivity of OIC Member Countries reached to
1,312 US dollars/ha, where it was 705 US dollars/ha in 1995. In a 5 year periods, a continual
increase in productivity was observed in the OIC and world. Compared to the world, the rate of
growth in agricultural land productivity in OIC Member Countries was higher than the world.
In other words, during the period 1995-2013 the agricultural land productivity of OIC Member
Countries increased by 86 percent, while it was only 61 percent in the world. The significant
rate of growths in both OIC agricultural land productivity and world realized between the
period 1995 and 2010. The reason for this substantial rate of growths in land productivity can
be explained by a dramatic increase in real agricultural value added, while arable land areas
remain almost same in these years.
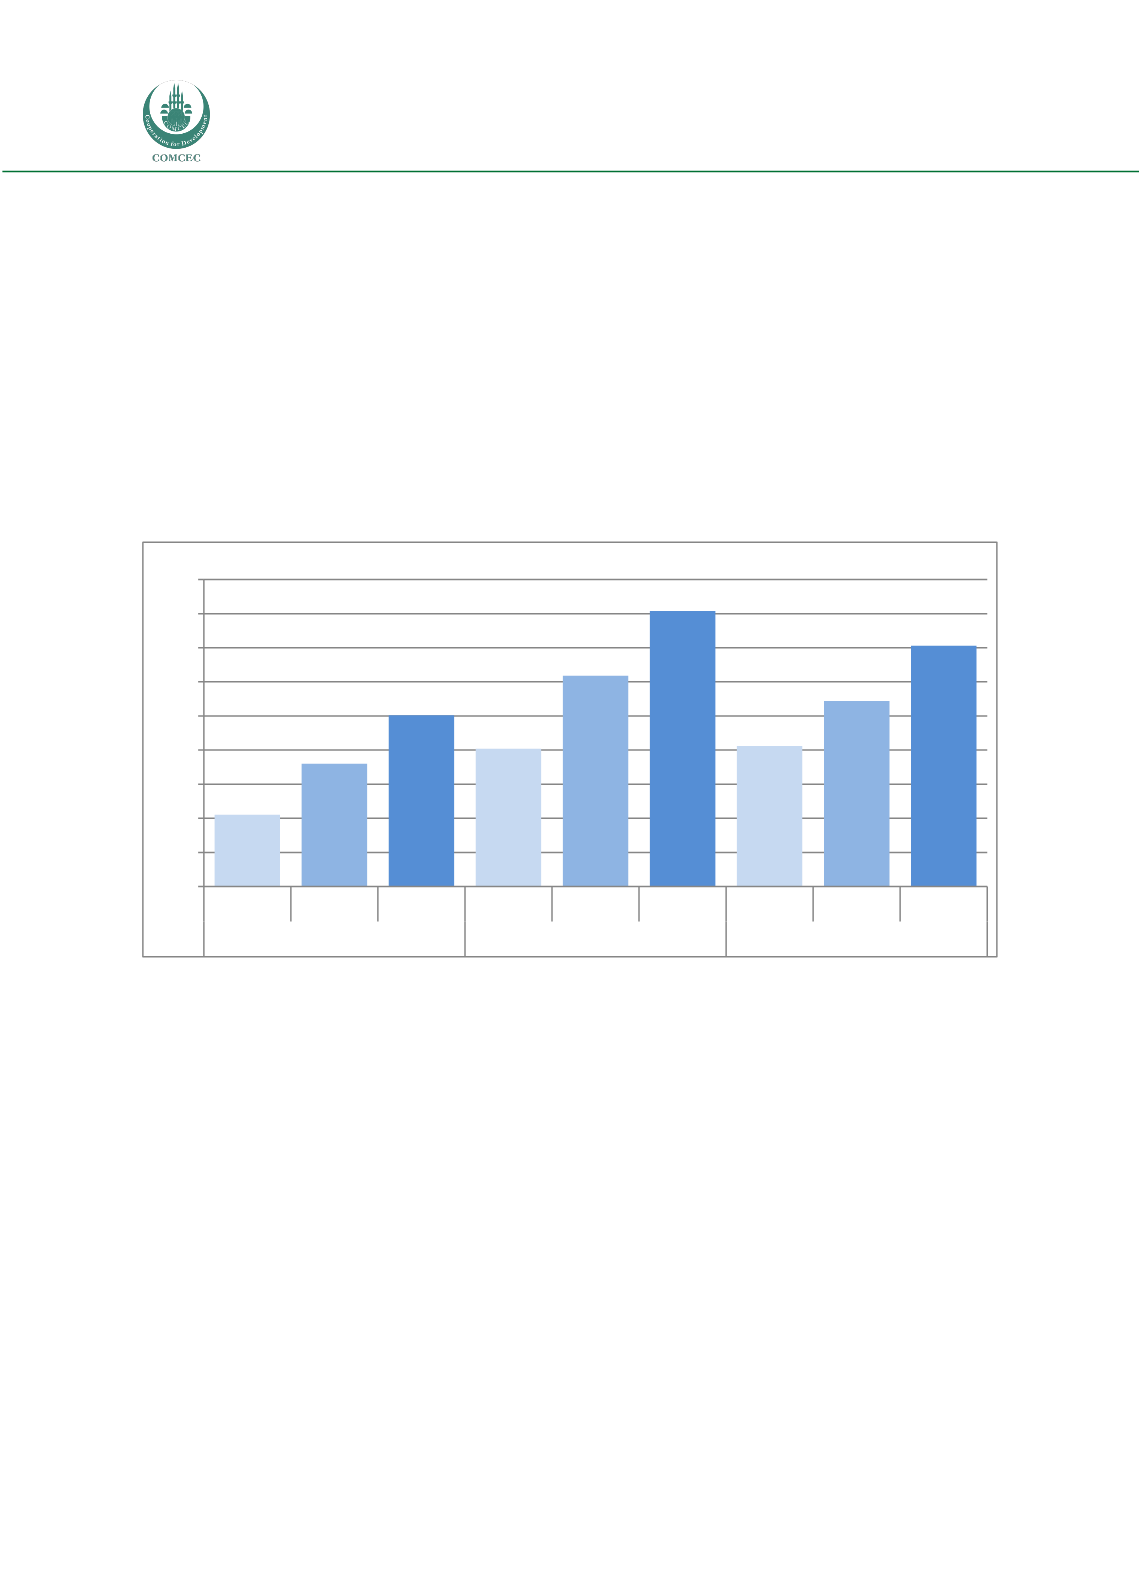
Figure 15. Land Productivity in the OIC by Sub-Regions
(Agr. GDP at 2005 constant prices)
Source: Calculated by Using FAO online databases, 2015
At the sub-regional level, Arab Group had the highest level of agricultural land
productivity in the OIC’s with 1,616 US Dollars per hectare in 2013. The low level of
agricultural arable land in Arab Group, which is one third of Asian Group and half of the
African Group, leads to agricultural land productivity of Arab Group the highest even thoug the
agricultural GDP of them is the lowest in the OIC. The Arab Group was followed by Asian Group
with 1,413 US Dollars per hectare agricultural land productivity in 2013. Among the all sub-
regions, African Group had a lowest level of agricultural land productivity during the period
1995-2013. On the other hand, although African Group had a lowest performance with respect
to agricultural land productivity over years; it accomplished the highest growth in the same
period with a more than 2 times increase in the level of agricultural land productivity (Figure
15).
421
719
1.005
807
1.236
1.616
825
1.088
1.413
0
200
400
600
800
1.000
1.200
1.400
1.600
1.800
1995
2005
2013
1995
2005
2013
1995
2005
2013
African Group
Arab Group
Asian Group
Dollar/ha