


 34 / 101

COMCEC Agriculture Outlook 2016
23
products are grown in the OIC as a whole. Member States have different yield level depending
on their level of using agricultural mechanization and other agricultural inputs as well as
climatic conditions.
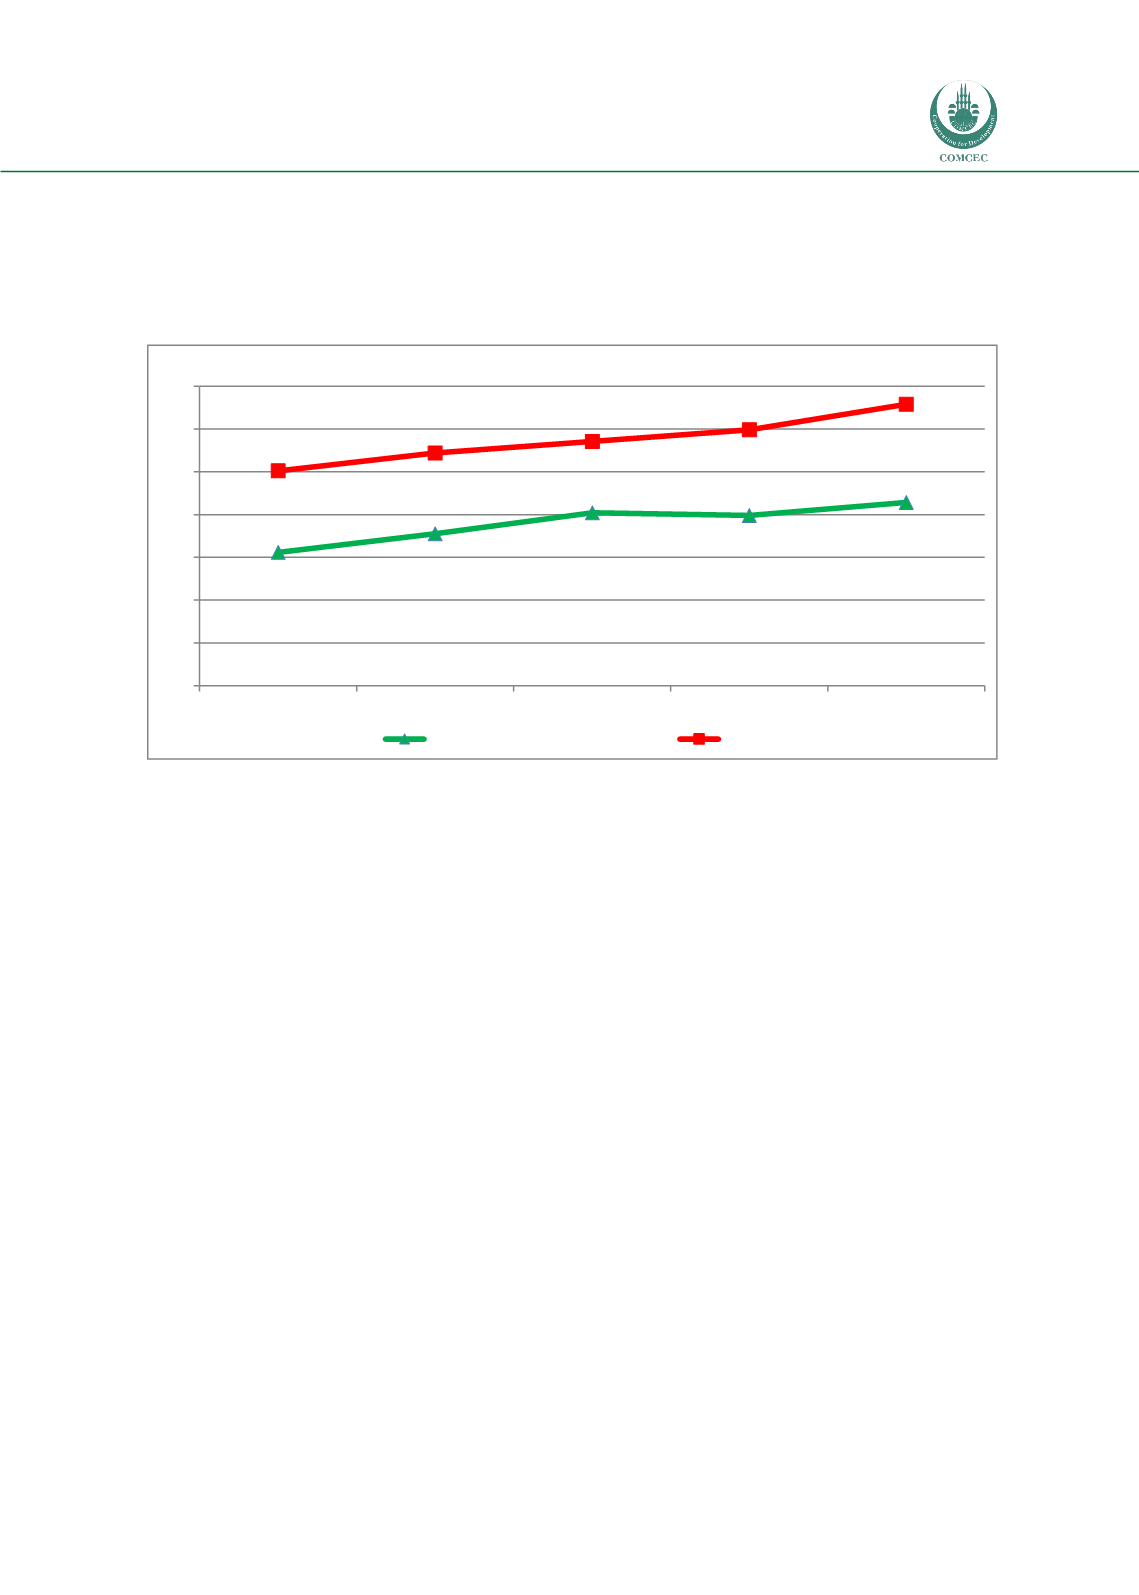
Figure 18. Wheat Yield in the OIC and World
Source: Calculated by using FAOSTAT
Note: The data of 38 OIC Member Countries which has an up to date yield data are used.
Another important term for analyzing agricultural productivity is crop yields. Even crop
yields can be calculated for each agricultural product, it is useful to figure out the productivity
improvement in the most common, important and strategic crops. Therefore, wheat, maize and
cotton seed which plays a crucial role in the OIC production, consumption and trade are
selected in order to analyze the crop yields in this study.
Figure 18 shows the yield of wheat which is one of the most common cultivated
products in the OIC. In 2014, average wheat yield of OIC Member Countries reached to 2.1
tons/hectare, where it was 1.6 tons/hectare in 1995. As can be seen from this Figure, wheat
yield increased in general both in the OIC and in the world for last two decades. As of 2014,
world average wheat yield was 54 percent higher than OIC.Another key crop for OIC Member
Countries is maize which is used for both human consumption and livestock feed. It is
considered as a staple food with a high nutritional value for many millions of people in
developing countries, especially sub-Saharan Africa. Furthermore, its stalks can be used to
provide fodder for livestock in rural areas where farmers have difficulties to reach compound
feed.
1,6
1,8
2,0
2,0
2,1
2,5
2,7
2,9
3,0
3,3
0,00
0,50
1,00
1,50
2,00
2,50
3,00
3,50
1995
2000
2005
2010
2014
Yield (tonnes/ha)
OIC
World