
COMCEC Agriculture Outlook 2016
22
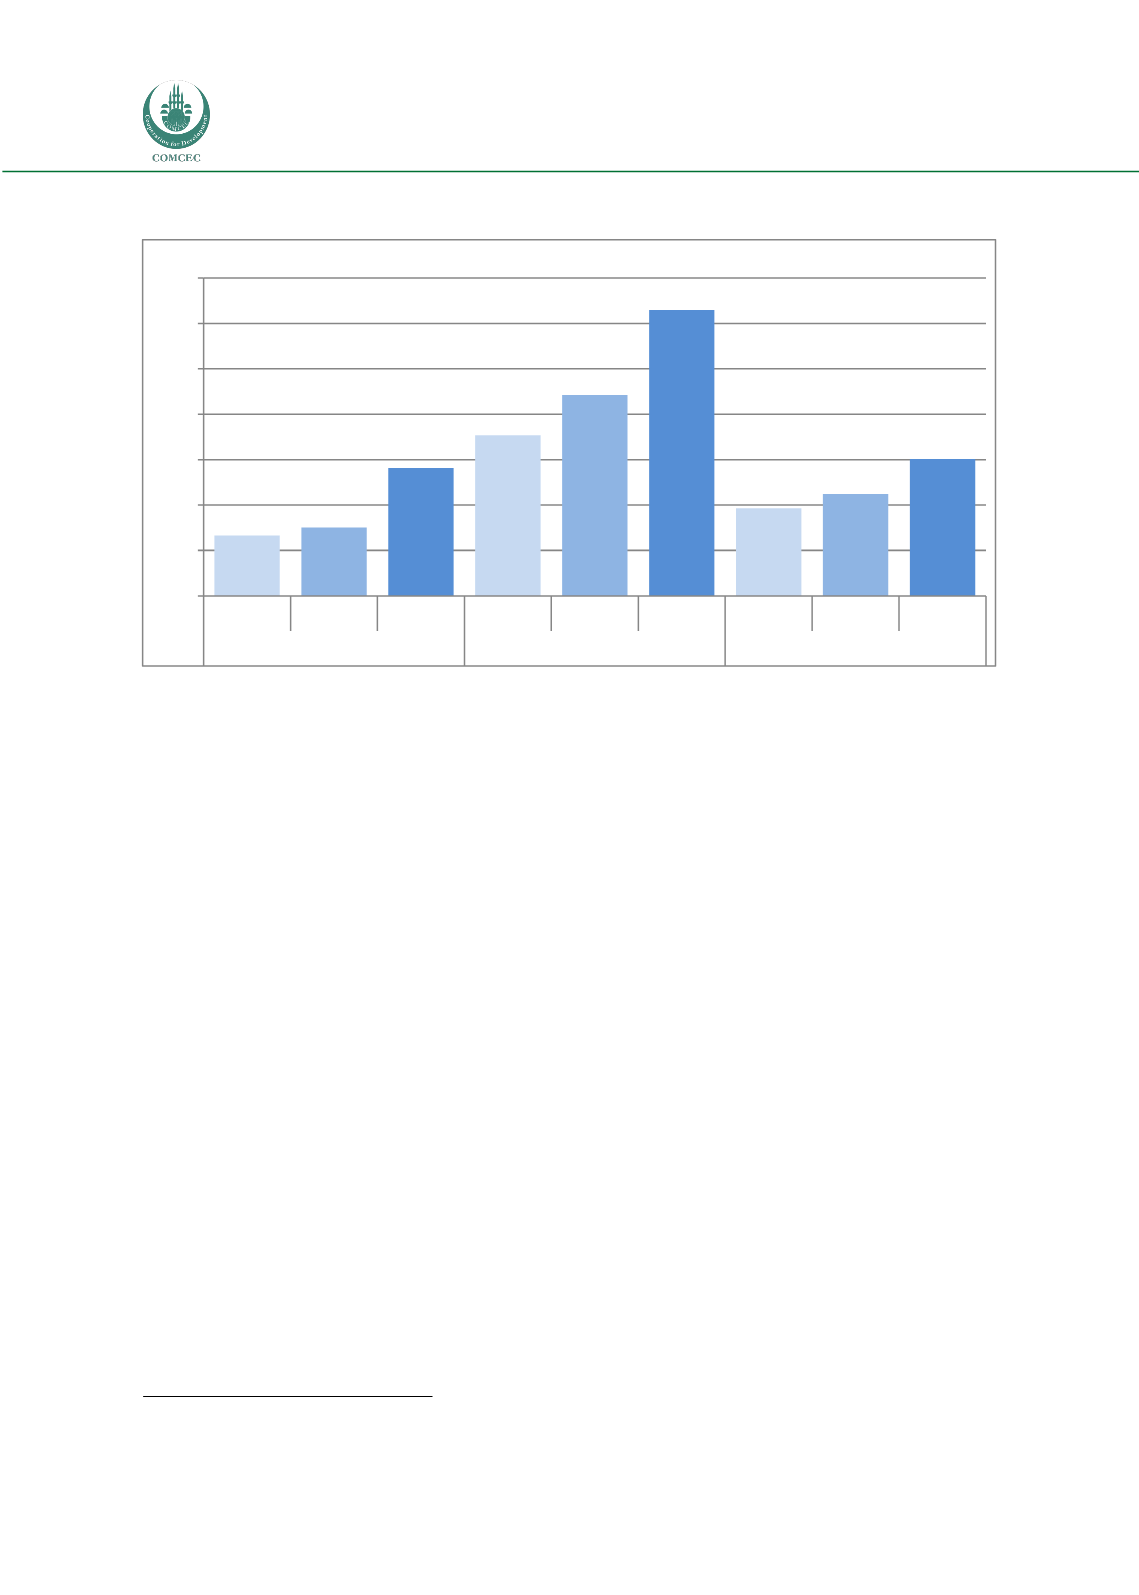
Figure 17. Labor Productivity in the OIC by Sub-Regions
(Agr. GDP at 2005 constant prices)
Source: Calculated by using UNSTAT and FAOSTAT
On the other hand, Figure 17 reveals that Arab Group has the highest labor productivity
among the three regions. As of 2013, average agricultural labor productivity of Arab Group
Countries increased to 3,146 US dollars/person, where it was lower than 2,000 US
dollars/person at the beginning of 1990s. Looking at the individual countries in the Arab
Group, Lebanon, Kuwait, Saudi Arabia, Bahrain, Qatar and United Arab Emirates, has the high
level labor productivity. Although the levels of labor productivity are high in the OIC, it must be
recognized that the region is unsuitable for agriculture development due to its limited water
resources and climatic conditions. In this context, the higher levels of labor productivity are
probably due to a host of factors including high levels of mechanization and use of fertilizer
and pesticides. It may be noted that the levels of labor productivity in the Lebanon, Kuwait and
Saudi Arabia are comparable to those in high income countries.
10
The level of labor productivity in the African Group was the lowest one in the OIC with
an average 1,408 US dollars/person in 2013. Some African Group Member Countries such as
Djibouti, Guinea, Gambia, Uganda and Mozambique had the lowest levels of labor productivity
of the OIC in this year. The low levels of mechanization and fertilizer use, water scarcity and
using labor intensive methods are the main reasons of the low agricultural labor productivity
in this sub-region.
2.3.3.
Crop Yields
The OIC Member Countries pursue a wide range of crop and livestock production
system because of the fact that they have different agro-ecological zone, agricultural
infrastructure, and producing and consuming habit. Hence, a large variety of agricultural
10
IDB, 2009
666
753
1.408
1.766
2.210
3.146
965
1.121
1.507
0
500
1.000
1.500
2.000
2.500
3.000
3.500
1990
2000
2013
1990
2000
2013
1990
2000
2013
African Group
Arab Group
Asian Group
Dollar/labor


