


 27 / 101

COMCEC Agriculture Outlook 2016
16
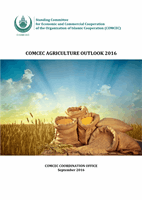
Table 5. Land Use in the OIC and its Share in the World, 2013
Land Area
Agricultural
Area
Arable Land
Permanent
Crops
Permanent
Meadows
and
Pastures
OIC (million ha)
3,179
1,409
306
63
1,040
Share in Total Agr. Area (%)
100.0
21.7
4.5
73.8
World (million ha)
13,009
4,929
1,408
165
3,354
Share of OIC in the World (%)
24.4
28.6
21.8
38.2
31.0
Source: Calculated by using FAOSTAT
Table 5 provides some data on amounts of total land, agricultural land, permanent crops
land and permanent meadows, and pastures in the OIC Member Countries as well as in the
world. As seen at this Table, the OIC Member Countries’ total land area of 3.2 billion hectares,
equal to 24 percent of the world. Almost 1.4 billion hectares, representing 44 percent of this
total land is used as agricultural land. The OIC’s agricultural area share in the land area is
higher than the world average which is 38 percent.
In the OIC, out of this 1,4 billion hectares agricultural area, 306 million hectares are
arable land, 63 million hectares are reserved for permanent crops, and more than 1 billion
hectares are used as permanent meadows and pastures. As understood from these figures,
most of the OIC Member Countries’ agricultural area, 74 percent, consists of permanent
meadows and pastures. This is almost parallel with the general distribution in the world where
68 percent of agricultural area separated as permanent meadows and pastures. However, as
compared to EU where 60 percent of the agricultural land was used for arable crops, 33
percent for permanent pasture and 6 percent for permanent crops, the OIC Member Countries
have very high level of permanent meadows and pastures but arable land is very low as a
percentage. Therefore, it is very crucial for the Member Countries to utilize these lands for
increasing agricultural production.
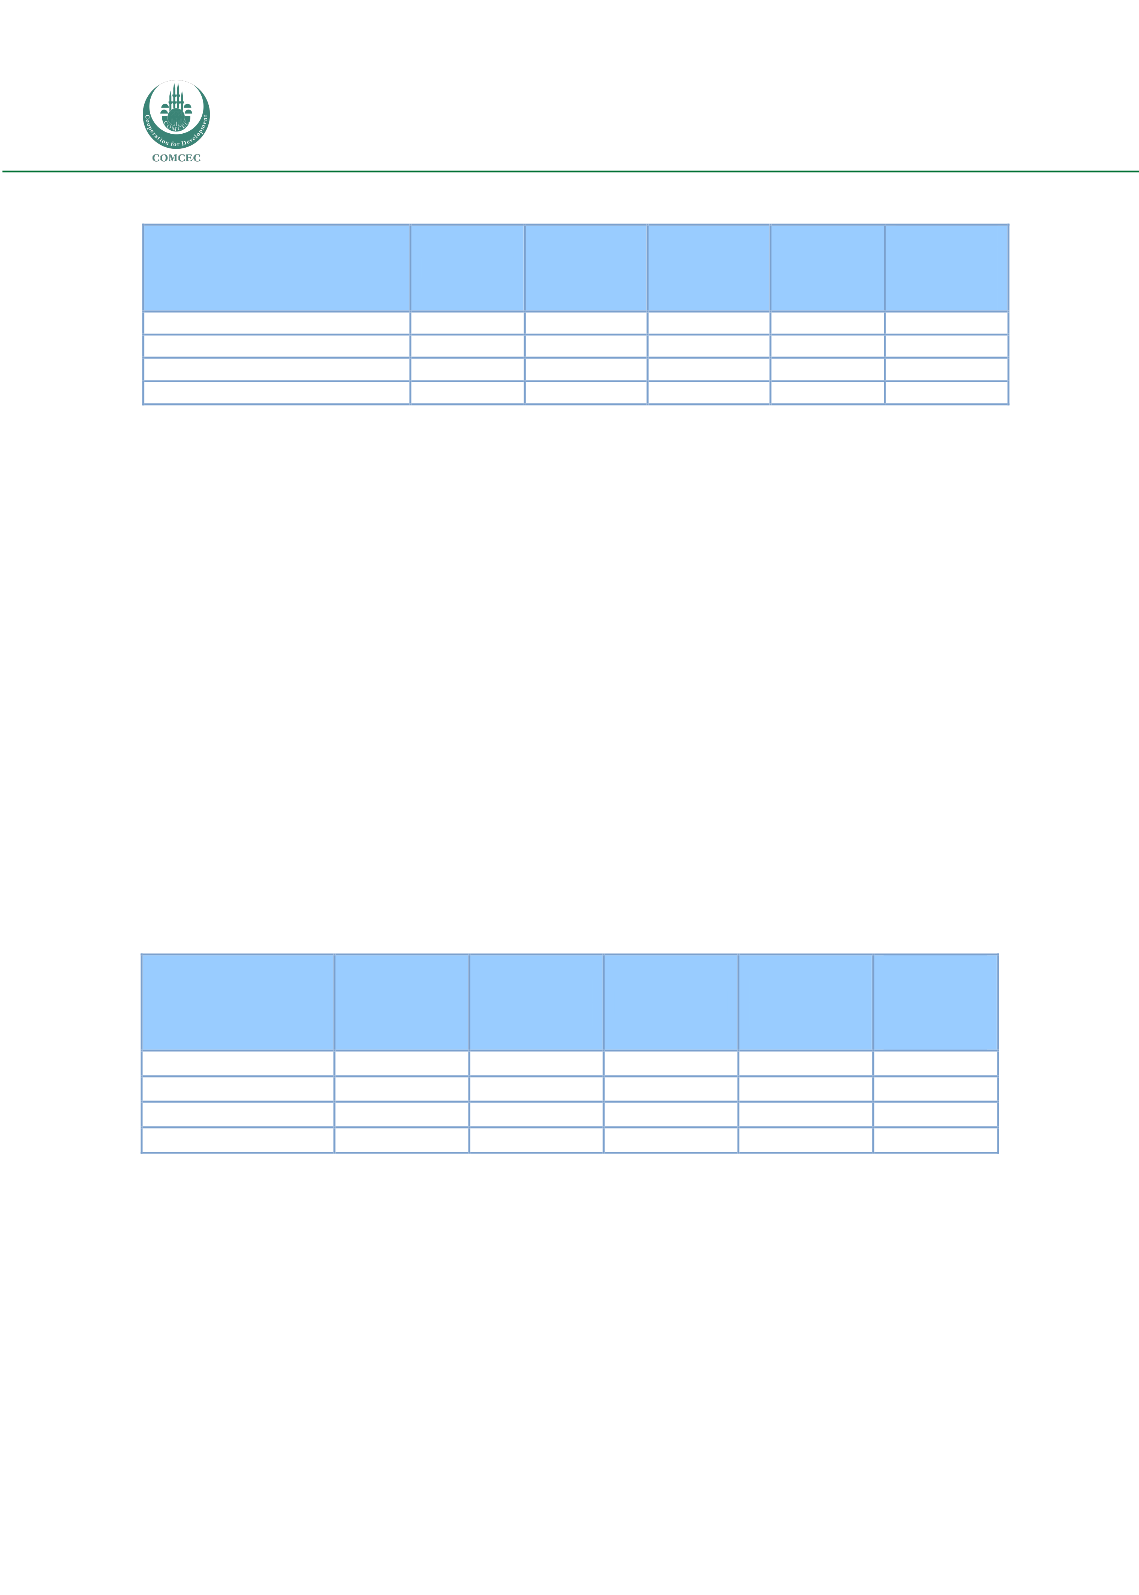
Table 6. The Share of Land Use in the OIC by Sub-Regions, 2013
OIC Sub-region
Land Area
Agricultural
Area
Arable Land
Permanent
Crops
Permanent
Meadows
and
Pastures
African Group (%)
24.2
25.3
33.8
27.8
22.6
Arab Group (%)
42.8
36.9
18.3
13.3
43.7
Asian Group (%)
33.0
37.9
47.9
58.9
33.6
OIC Total (%)
100.0
100.0
100.0
100.0
100.0
Source: Calculated by using FAOSTAT
On the other hand, Table 6 reveals that at the sub-regional level, Arab Group and Asian
Group have almost same hectare of agricultural area, each constitutes 37-38 percent of the
total agricultural area of the OIC. They are followed by African Group with 25 percent.
Furthermore, Arab Group has the highest levels in terms of permanent meadows and pastures
with 44 percent of the OIC. In terms of both arable land and permanent crops, Asian Group has
the highest level with 48 and 59 percent, respectively.
Additionally, looking at the individual country level Kazakhstan with 15.4 percent, Saudi
Arabia with 12.3 percent, Sudan with 7.7 percent, Nigeria with 5.0 percent, and Indonesia with