


 24 / 101

COMCEC Agriculture Outlook 2016
13
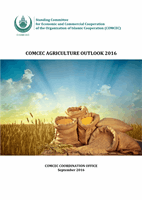
Figure 9. Agricultural Exports and Imports in the OIC
Source: Calculated by using FAOSTAT
The export/import ratio which is a useful indicator for assessing the trade performance
is also shown in the Figure 9. As it is seen in the Figure, while the ratio of export to import was
around 58 percent in 1990, it increased to almost 70 percent in 2010. Nonetheless, the
export/import ratio has shown a declining path in recent years and the poor performance in
agricultural export in 2013 affected badly the export/import ratio, regressing to 59 percent.
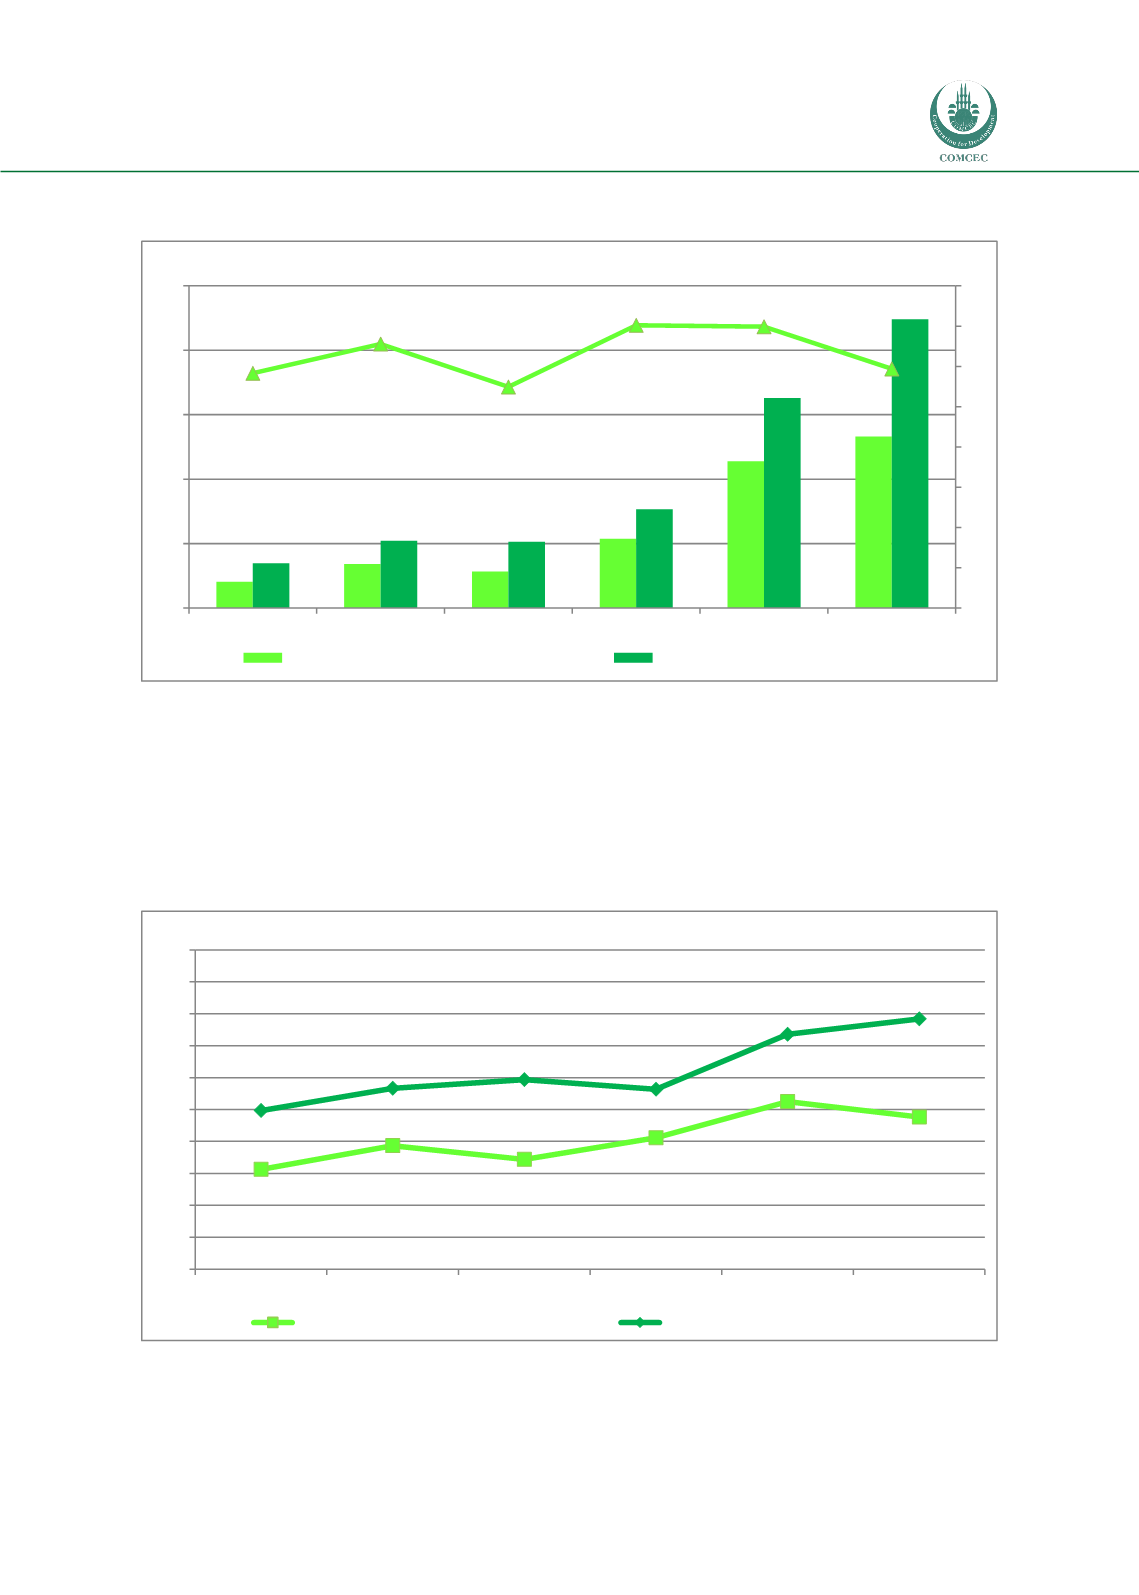
Figure 10. OIC Agricultural Trade Performance in the World
Source: Calculated by using FAOSTAT
58,3
65,5
54,9
70,2
69,9
59,4
0
10
20
30
40
50
60
70
80
0
50
100
150
200
250
1990
1995
2000
2005
2010
2013
Billion Dollar
Percent
OIC Member Countries Total Export
OIC Member Countries Total Import
6,2
7,7
6,9
8,2
10,5
9,5
9,9
11,3
11,9
11,3
14,7
15,7
0
2
4
6
8
10
12
14
16
18
20
1990
1995
2000
2005
2010
2013
Percent
Share of OIC Agr. Export in the World
Share of OIC Agr. Import in the World