
COMCEC Agriculture Outlook 2016
24
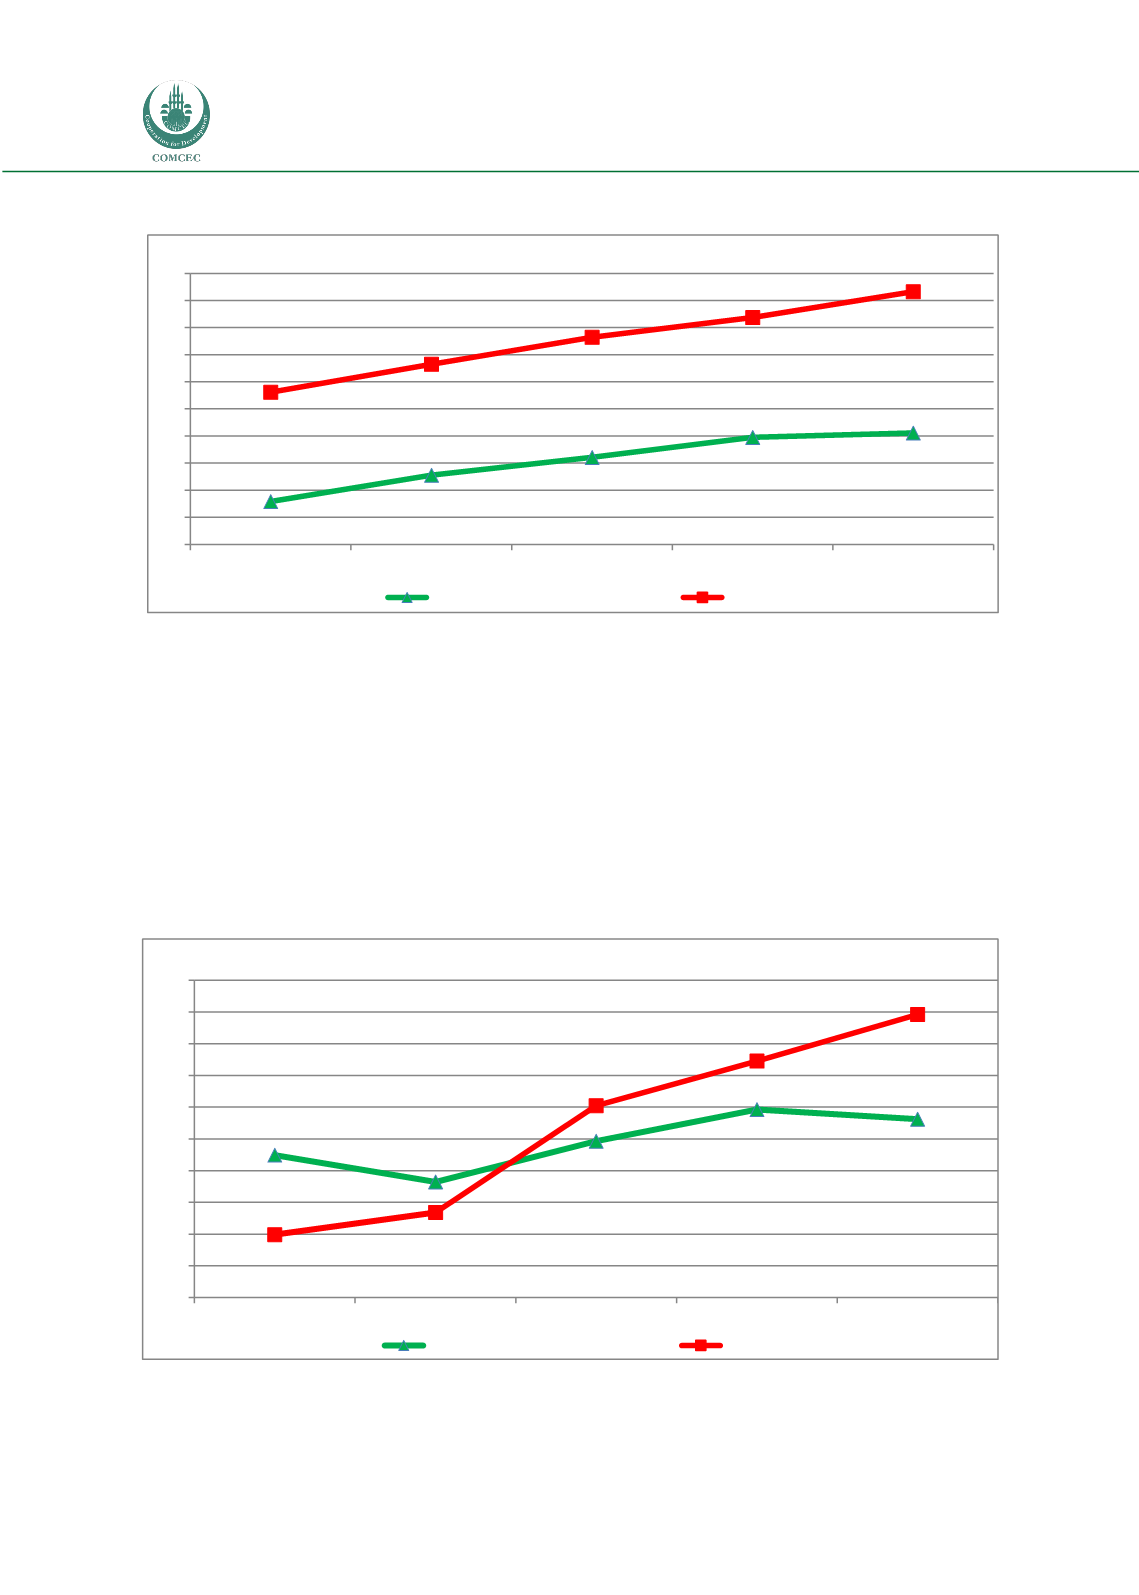
Figure 19. Maize Yield in the OIC and World
Source: Calculated by using FAOSTAT
Note: The data of 52 OIC Member Countries which has an up to date yield data are used.
Figure 19 shows the maize yield in the OIC and world. In 2014, average maize yield of
OIC Member Countries reached to 3.1 tons/hectare, where it was 1.8 tons/hectare in 1995.
Compared to the world, the increase in maize yield in the OIC Member Countries between
1995 and 2014 was higher; i.e., 70 percent for the OIC and almost 50 percent for the world.
Nonetheless, the maize yield in the OIC is considerable lower than the world average overtime,
and it is still behind the world’s level in 1990s. As of 2014, world average wheat yield was 85
percent higher than OIC’s.
Figure 20. Cotton Yield in the OIC and World
Source: Calculated by using FAOSTAT
Note: The data of 37 OIC Member Countries which has an up to date yield data are used.
1,8
2,3
2,6
3,0
3,1
3,8
4,3
4,8
5,2
5,7
1,0
1,5
2,0
2,5
3,0
3,5
4,0
4,5
5,0
5,5
6,0
1995
2000
2005
2010
2014
Yield (tonnes/ha)
OIC
World
1,85
1,76
1,89
1,99
1,96
1,60
1,67
2,00
2,15
2,29
1,40
1,50
1,60
1,70
1,80
1,90
2,00
2,10
2,20
2,30
2,40
1995
2000
2005
2010
2014
Yield (tonnes/ha)
OIC
World


