


 25 / 101

COMCEC Agriculture Outlook 2016
14
Figure 10 illustrates the OIC’s agricultural trade performance in the world. The share of
OIC Member Countries’ agricultural imports in the world increased to 15.7 percent in 2013
from 9.9 percent in 1990. Correspondingly, the contribution of OIC agricultural exports to
world total agricultural export reached to 9.5 percent. Both agricultural import and export
significantly rose in the period of 2005-2010. Nonetheless, the shift in export and import were
different in the period 2010-2013. While the share of agricultural commodity import of the OIC
Member Countries continued to rise, the contribution of OIC agricultural exports to world total
agricultural export declined.
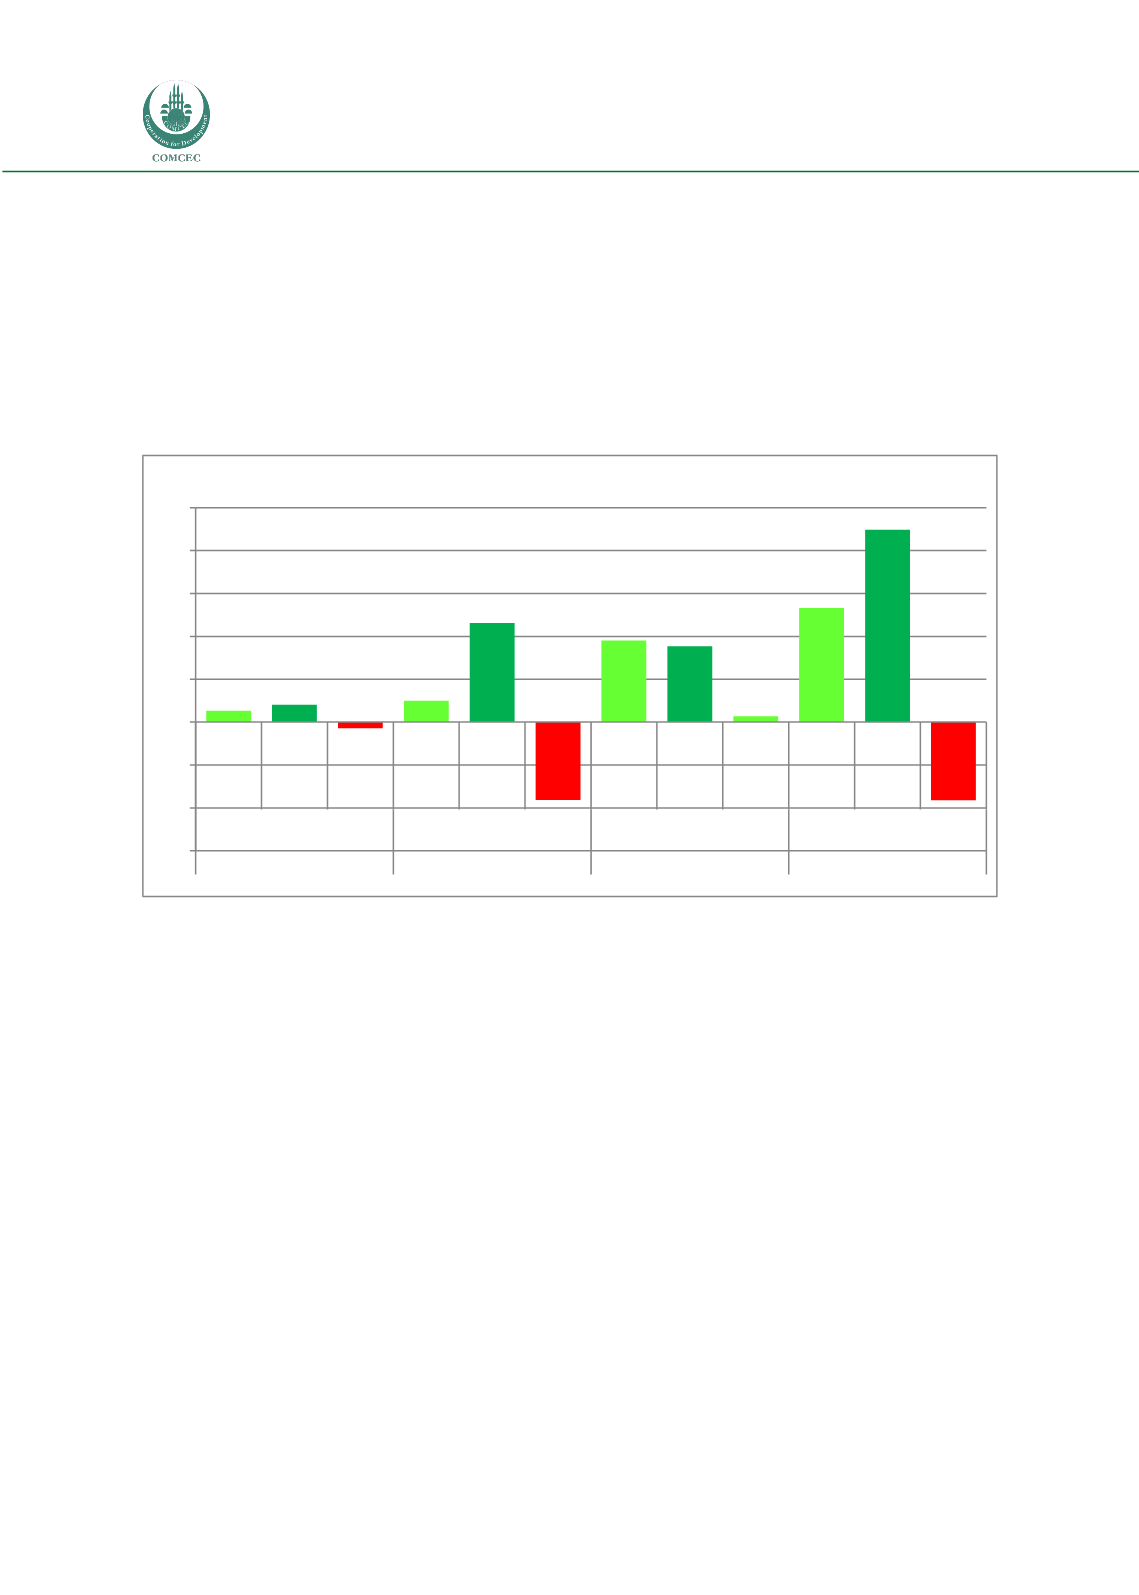
Figure 11. Agricultural Trade Balance in the OIC by Sub-Regions, 2013
Source: Calculated by using FAOSTAT
Most of the OIC Member Countries have a trade deficit in agriculture sector. It means
that the agricultural commodity imports exceed their exports, and it creates an outflow of
domestic currency to foreign markets. As of 2013, 91.1 billion US Dollars trade deficit occurred
in the OIC. Figure 11 depicts the agricultural trade balance in the OIC by Sub-Regions in 2013.
It is seen in the figure that the only group which has a positive trade balance was Asian Group
with a 6.8 billion US Dollars. On the other hand, African Group and Arab Group have trade
deficits, 7.0 and 90.9 billion US Dollars, respectively.
At the sub-regional level, Asian Group had the highest level of share in the OIC’s
agricultural commodity export with 71 percent in 2013. As of 2013, Asian Group was followed
by Arab Group and African Group with 19 percent and 10 percent agricultural commodity
export respectively. In terms of agricultural commodity import, Arab Group accounted for 52
percent of the OIC’s total in the same period. It was followed by Asian Group and African Group
with 39 percent and 9 percent, respectively (Figure 11).
13,2 20,2
-7,0
24,8
115,7
-90,9
95,1 88,3
6,8
133,1
224,2
-91,1
-150
-100
-50
0
50
100
150
200
250
Export Import Trade
Balance
Export Import Trade
Balance
Export Import Trade
Balance
Export Import Trade
Balance
African Group
Arab Group
Asian Group
OIC Total
Billion Dollar