
38
COMCEC Agriculture Outlook 2019
35
32
30
30
25
23
23
20
15
13
10
10
7
4
2000
2005
OIC
2010
World
2013
3.4
Stability
The definition of food security stresses the time spatial extent of food security by stating “when
all people,
at all times
, have physical, social and economic access to safe and nutritious food
for an active and healthy life”. In this definition,
at all times
refer to the stability aspect by
covering the availability, access and utilization dimension of food security on a periodic basis.
Furthermore, it emphasizes the importance of having toreduce the riskof adverse effects on the
other three dimensions, namely availability, access and utilization. Therefore, these three
dimensions should be stable over time and not be affected negatively by natural (drought,
floods), social (unemployment), economic, (rising food prices) or political factors (social
unrest).
Accordingly, FAO describes the stability dimension of food security such that a population,
household or individual must have acquire toadequate food
at all times
without any risk losing
access to food as a consequence of sudden shocks (e.g. an economic or climatic crisis) or cyclical
events (e.g. seasonal food insecurity).
16
In the FAOstudy of food security indicators, the access dimension of food security is measured
by various indicators such as cereal import dependency ratio, percent of arab le land equipped
for irrigation, value of food imports over total merchandise exports, political stability and
absence of violence/terrorism, domestic food price volatility, per capita food production
variability, per capita food supply variability. In this study, among these indicators, per capita
food supply variabilitywhich compares the variations of per capita food supply across countries
and time is seen as themost useful indicator toassess the stability dimension of food security in
the OIC member countries.
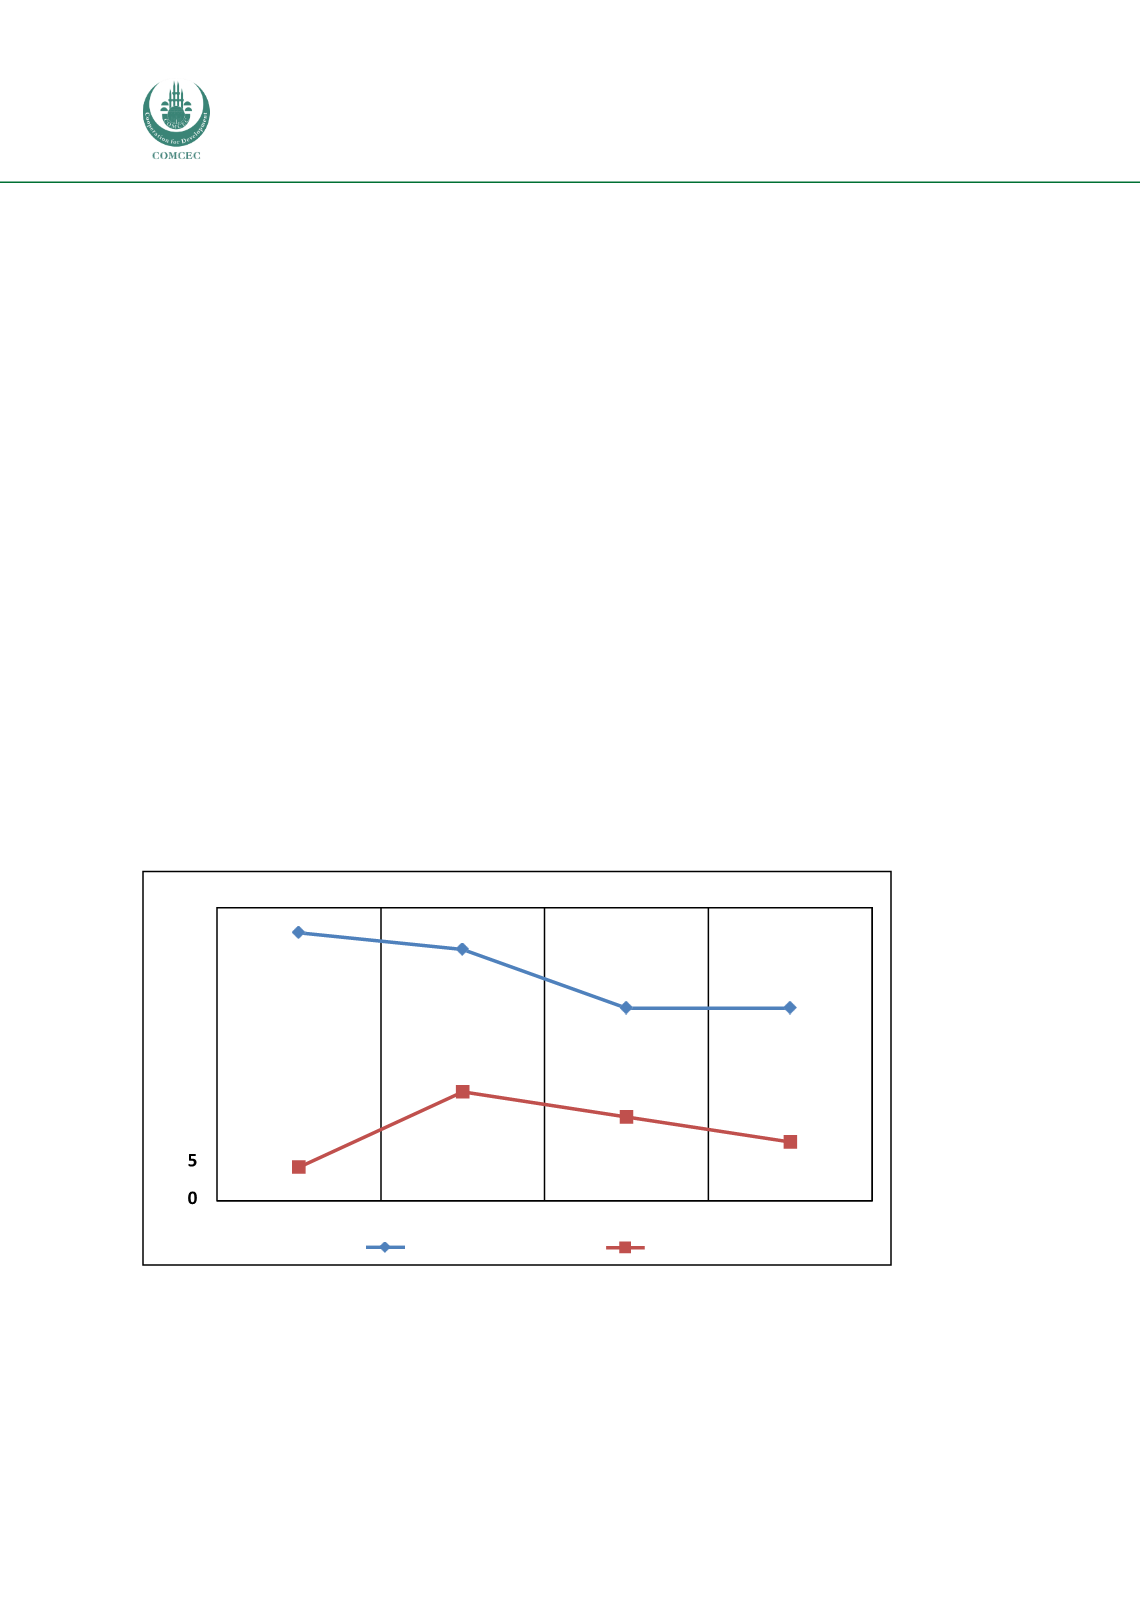
Figure 37 Per Capita Food Supply Variability, kcal/capita/day
Source: Annex 41
Figure 37 and 38 illustrates the domestic food price volatility index that corresponds to the
variability of the "food supply in kcal/caput/day" in the world and OIC member countries,
respectively. The variability index series is calculated by fitting a cubic spline trend by


