


 44 / 107

33
COMCEC Agriculture Outlook 2019
gr/caput/day
90
85
80
75
70
75
69
65
63
63
64
60
61
62
60
55
56
50
45
40
1999-2001
2014-2016
2004-2006
1999-2001
2014-2016
African Group
Arab Group
Asian Group
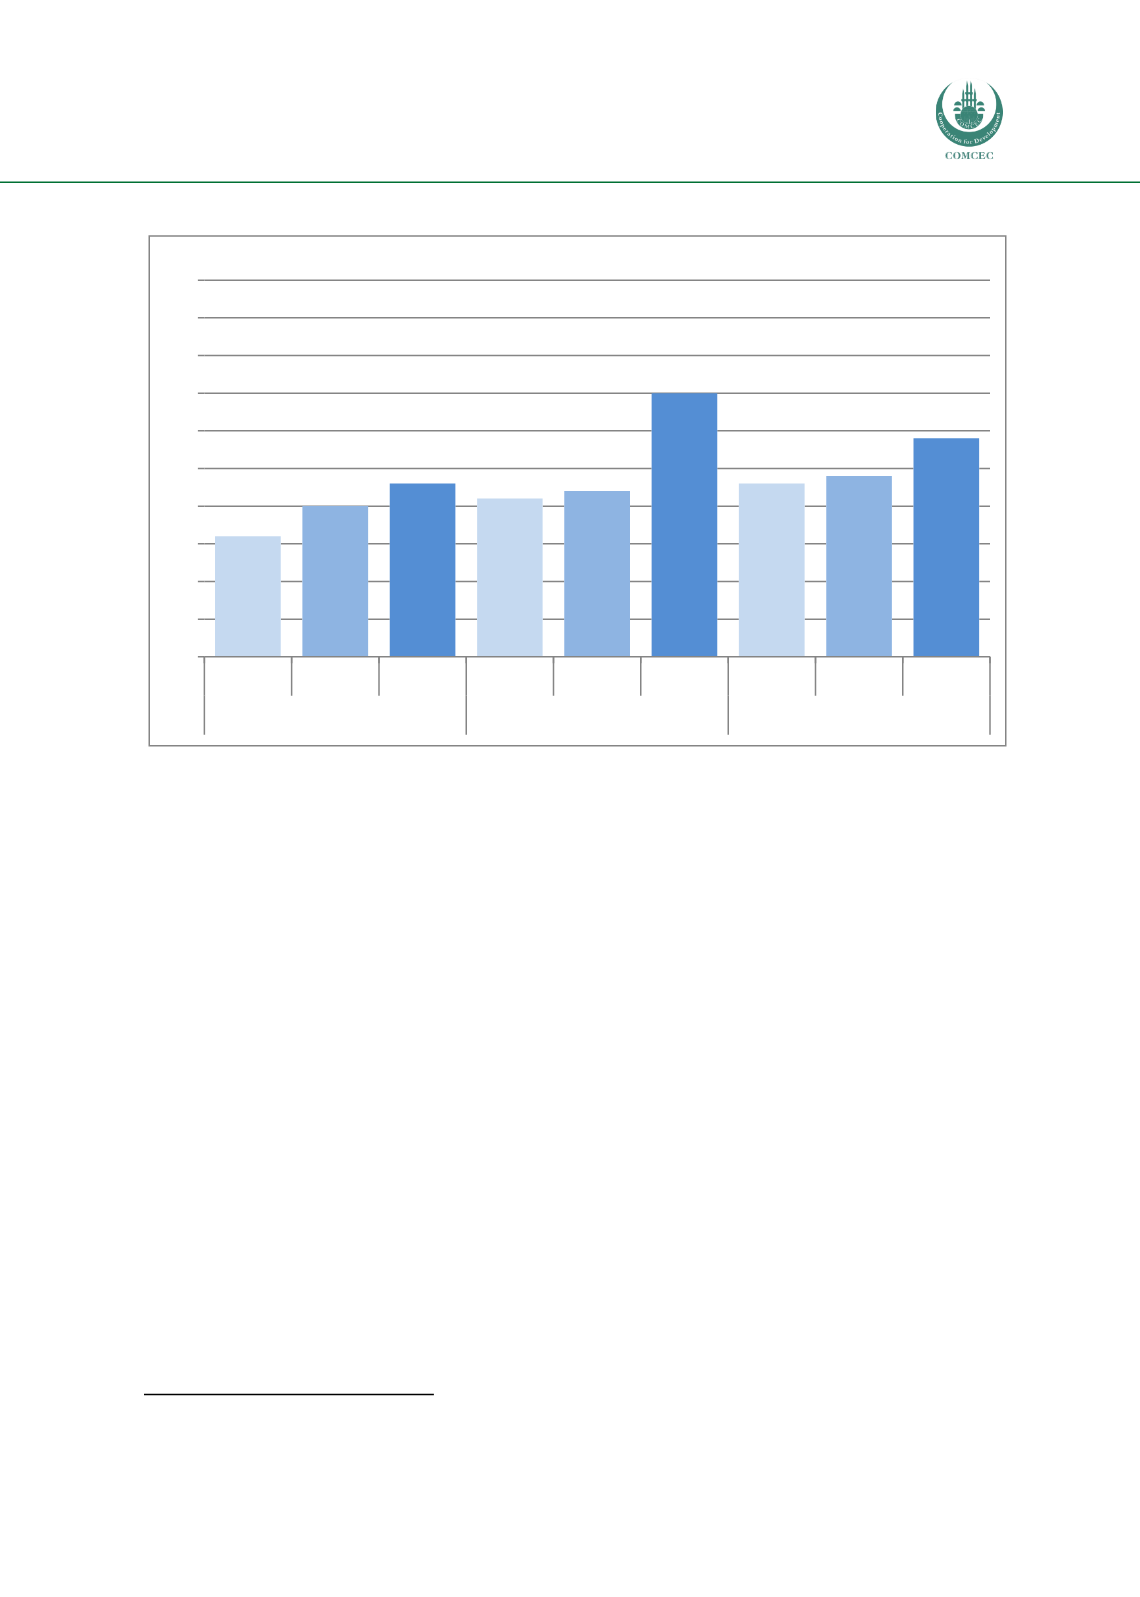
Figure 30 Average Protein Supply in the OIC Sub-Regions
Source: Annex 37
Furthermore, number of people at risk of undernourishment is a broad indicator. According to
FAO definition, undernourishment means that a person is not able to acquire enough food to
meet the dailyminimum dietary energy requirements, over a period of one year. The number of
undernourished people in the OIC is calculated by applying the estimated prevalence of
undernourishment to total population.
Figure 31 displays that as of 2016-2018, 229.8 million people are expected to be
undernourished in the OIC member countries which accounts for 28.37 percent of
undernourished people in the World. In the last 20 years, while the number of undernourished
people in the World has fallen gradually, it remained almost the same in the OIC member
countries. Therefore, the share of OIC in undernourished people of the World has risen from
21.75 percent in 1999-2001 to28.37 percent 2016-2018. This can be explained by the impact
of the surge in food insecurity, particularly after the food crisis in 2006-2008 that brought
forth serious socioeconomic challenges both for households and policy makers in the
developing regions of Asia & Pacific, Sub-Saharan Africa and Latin America & Caribbean where
themajority of the OIC member countries are located.
13
13
SESRIC, 2015