


 46 / 107

35
COMCEC Agriculture Outlook 2019
3.2 Access
World Health Organization defines the food access as having sufficient resources to obtain
appropriate foods for a nutritious diet.
14
Access dimension of food security is fully met when all
people in a country have all adequate resources needed toacquire sufficient nutritious and safe
food. Therefore, the concept of food accessibility encompasses several issues such as
affordability of individuals to purchase foods, distribution of income and consumption,
existence of nutritious goods in nearby grocery stores, sufficient and convenient transportation
nets to reach local food retailers.
In the FAOstudy of food security indicators, the access dimension of food security is measured
by various indicators such as percent of paved roads over total roads, road density, rail lines
density, gross domestic product per capita, domestic food price index, prevalence of
undernourishment, share of food expenditure of the poor, depth of the food deficit, distribution
of consumption and prevalence of food inadequacy.
15
Two of the most important indicators of access are the average level of income and the
distribution of the income in a country. In this section we present two such indicators, namely
GDP Per Capita, Food Prices, and Calorie Consumption Distribution.
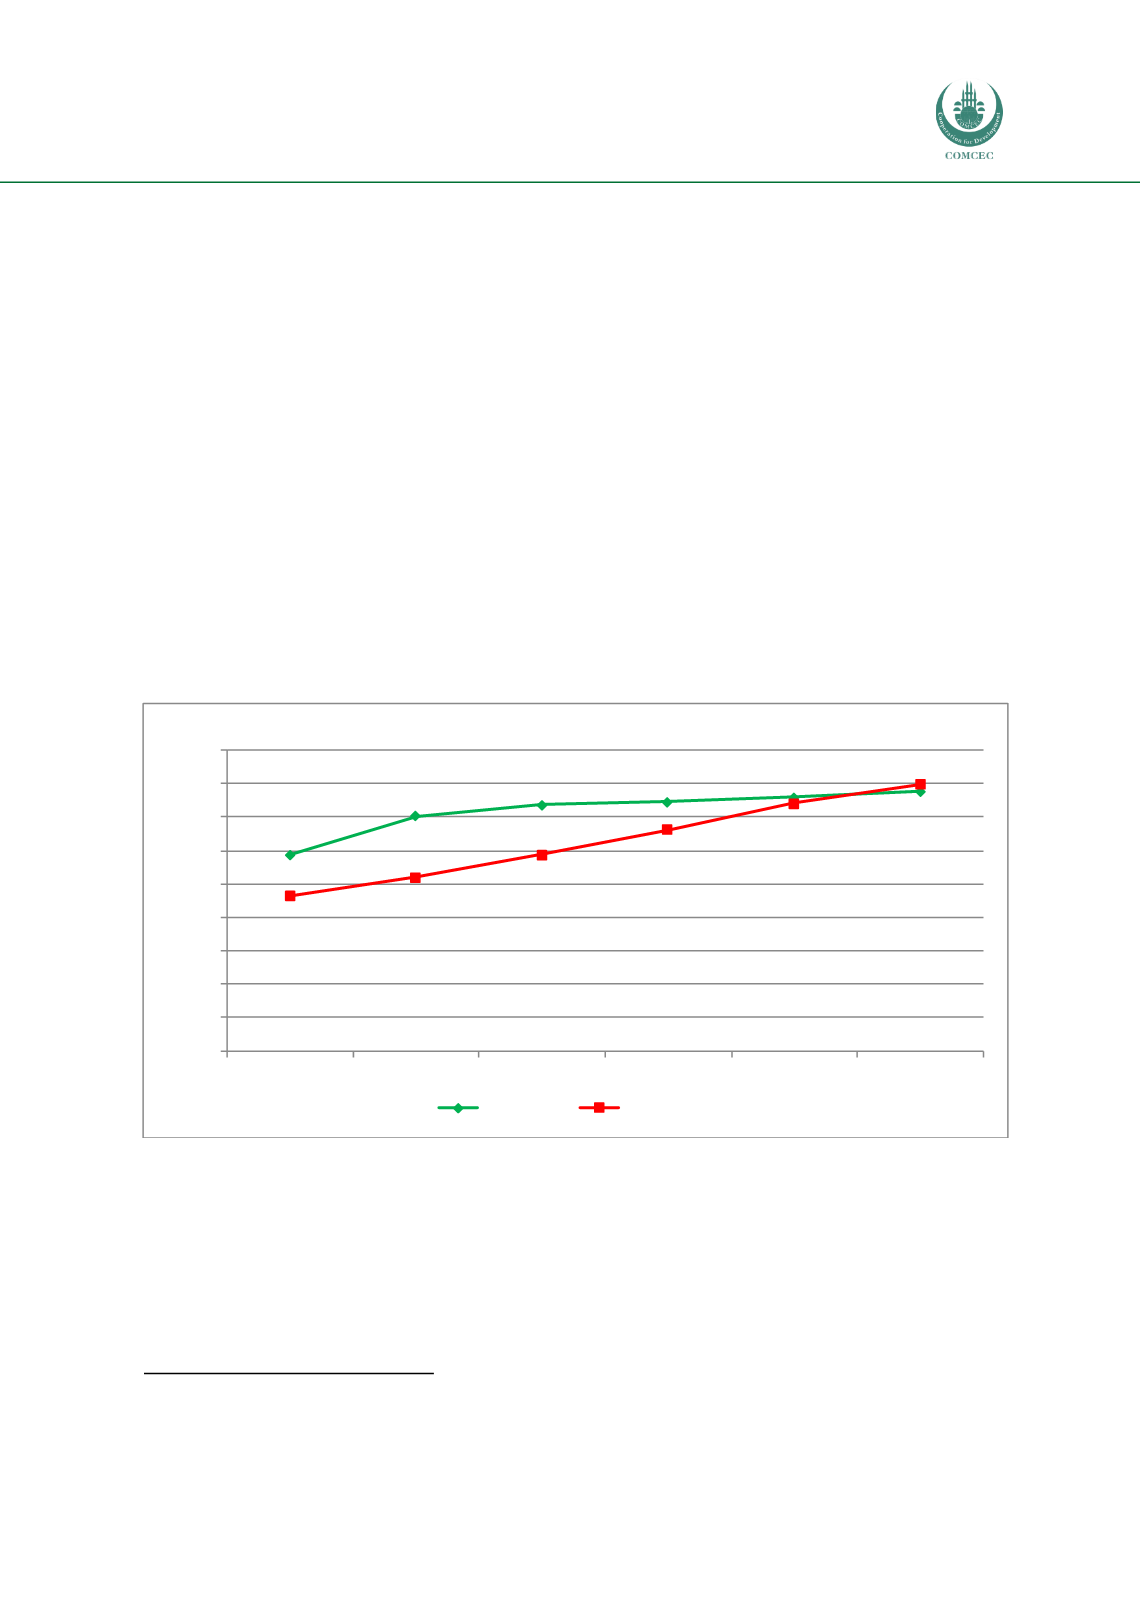
Figure 33 GDP Per Capita in the OIC and World
Source: Annex 39
GDP Per Capita
: Figure 33 demonstrates the developments in GDP per capita valued at constant
2011 International Dollars using purchasing power parity rates in the OIC and World and by
using a weighted population averages. Therefore, this indicator provides information on the
possibility of economical access tomarkets taking intoaccount the purchasing power of regions.
As it is seen in the figure, average GDP per capita of the OICmember countries reached 15,540
Int. Dollars, while it was 11,748 Int. Dollars in 1995s. Compared to theworld, average GDP per
capita of the OIC member countries was far away from the world average, which was almost
14
WHO, 2015
15
FAO, 2015b
11,748
14,068
14,744
14,893
15,163
15,540
9,280
10,393
11,753
13,220
14,826
15,941
0
2000
4000
6000
8000
10000
12000
14000
16000
18000
1995
2000
2005
2010
2015
2018
Dollars
OIC Total
World Total