
43
COMCEC Agriculture Outlook 2019
levels can be that the exposure indicators were divided by total land area of the country in
order to eliminate the bias against the countries having broader lands.
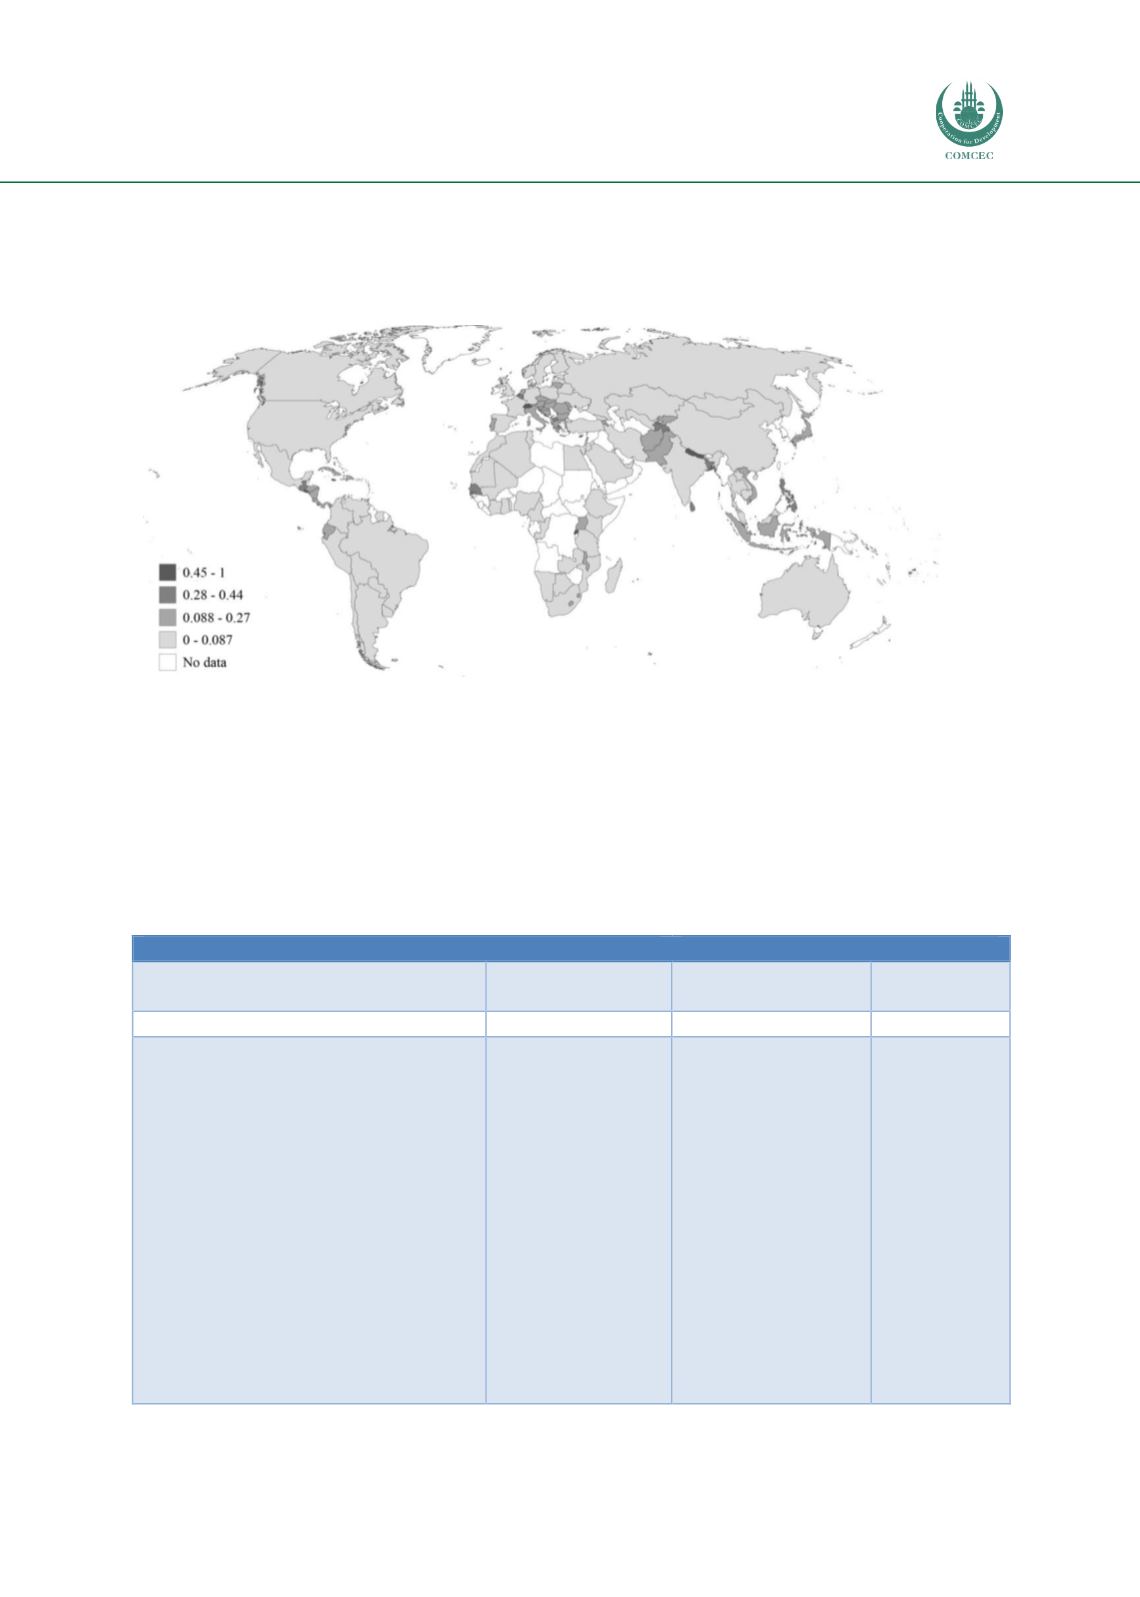
Figure 40 Exposure Index (EI) shown on theworld map
Exposure levels of 118 countries grouped into 4 as very low (0-0.087), low (0.088-0.27),
moderate (0.28-0.44), and high (0.45-1,00) based on the results of cluster analysis. Countries
with no datawere shown in white.
4.2. Sensitivity Index (SI) Scores
Normalized sensitivity index scores were shown in ascending order in Table 10 and on the
map in Figure 41.
Table 10 Cluster groups for Sensitivity Index (SI) Scores
Cluster 1
Cluster 2
Low Sensitivity
Moderate
Sensitivity
High Sensitivity
Very High
Sensitivity
(0-0,24)
(0,25-0,40)
(0,41-0,69)
(0,70-1,00)
UAE
, Canada, Switzerland, Cyprus,
Sweden, Slovakia, Norway, Finland,
Australia, Russia, Austria, Croatia, USA,
Slovenia, Latvia, Macedonia, Czech R,
Belarus Moldova, Spain, Hungary, Brazil,
Estonia, Chile, Germany, Bosnia and
Herzegovina, Cuba, Fiji, Greece, Lithuania,
Venezuela, Poland,
Albania
, France,
Portugal, Argentina,
Iran
, UK, Romania,
Kazakhstan
, Bulgaria, Denmark,
Malaysia
,
Saudi Arabia
, Italy, Mexico,
Colombia, Ukraine, Armenia, Georgia,
Costa Rica,
Kuwait, Tunisia, Turkey
,
Belgium,
Lebanon
(10)
Mauritius,
Algeria,
China,
Kyrgyz Rep.
,
Uruguay, Jamaica,
Panama, Ecuador,
Jordan
, Netherlands,
Thailand, Japan,
Morocco
,
Suriname
,
Uzbekistan
, Peru,
Honduras,
Dominican Rep.,
Trinidad and
Tobago, Paraguay, El
Salvador,
Indonesia
,
Malta, Nicaragua,
South Africa
(7)
Mongolia, Vietnam,
Mauritania
, Bolivia,
Nepal, Sri Lanka,
Philippines, India,
Pakistan,
Guatemala,
Ghana,
Senegal
,
Cameroon
,
Egypt
,
Cambodia,
Mali
,
Botswana, Lao,
Nigeria, Cote
d’Ivoire
, Lesotho,
Togo
,
Bangladesh,
Tajikistan
, Kenya
(11)
Uganda
,
Swaziland,
Namibia,
Afghanistan
,
Congo R,
Tanzania,
Madagascar,
Rwanda,
Malawi,
Ethiopia,
Mozambique
,
Zambia
(3)
* OIC Member States are highlighted


