


 32 / 107

21
COMCEC Agriculture Outlook 2019
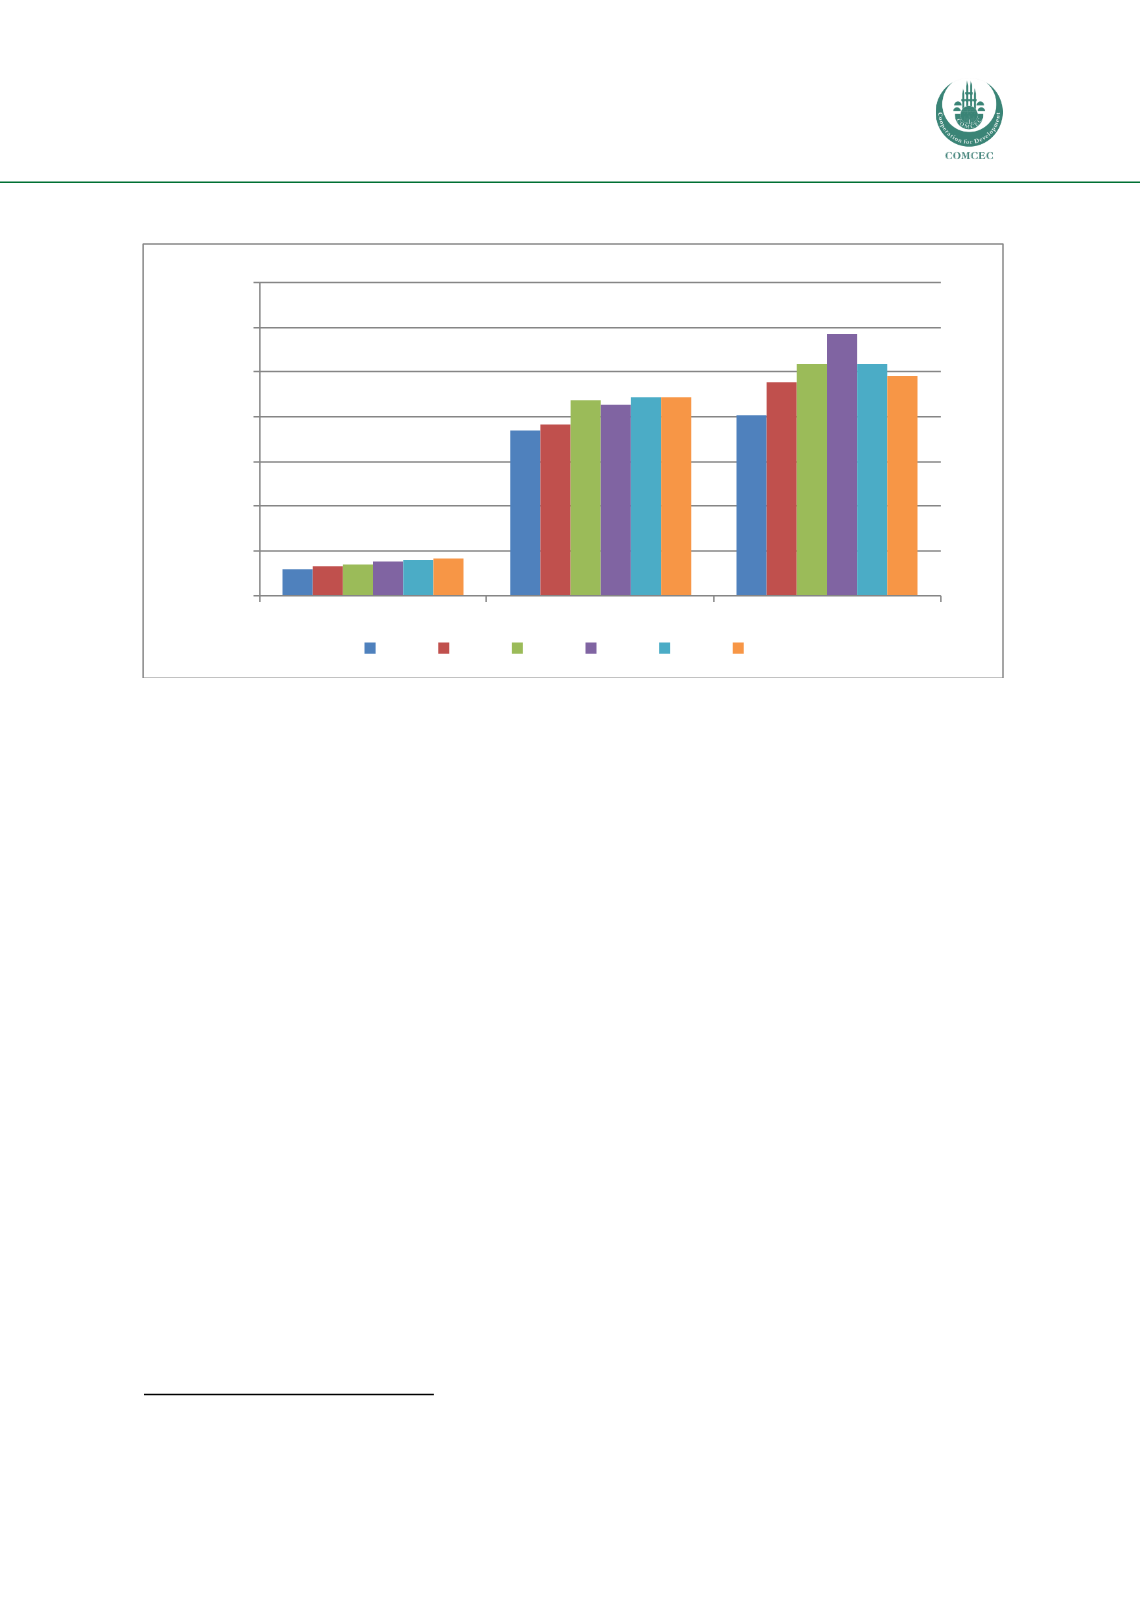
Figure 17 Labor Productivity in the OIC by Sub-Regions (Agr. GDP at 2010 constant prices)
Source: FAOSTAT
Figure 17 reveals that Asian Group has the highest labor productivity among the three regions.
As of 2017, average agricultural labor productivity of Asian Group increased to 9,847 US
dollars/person, from 8,032 US dollars/person at the beginning of 2000s. Looking at the
individual countries in the Arab Group, Lebanon, Kuwait, Saudi Arabia, Bahrain, Qatar and
United Arab Emirates, registered the high level labor productivity. Although the levels of labor
productivity are high in the OIC, it must be recognized that many countries in the region have a
serious obstacle for agricultural development due to limited water resources and unfavorable
climatic conditions. The higher levels of labor productivity are probably due to a host of factors
including high levels of mechanization and use of fertilizer and pesticides. It may be noted that
the levels of labor productivity in the Lebanon, Kuwait and Saudi Arabia arecomparable to those
in high income countries.
5
The level of labor productivity in the African Group was the lowest in the OIC with 1,638 US
dollars/person in 2017. Some African Group member countries such as Djibouti, Guinea,
Gambia, Uganda and Mozambique had the lowest levels of labor productivity among the OI C
member countries in this year.
2.3.3 Crop Yields
Another common indicator for analyzing agricultural productivity is crop yields. Even crop
yields can be calculated for each agricultural product, it should suffice to present improvements
in the most common, important and strategic crops. Therefore, wheat, maize and cotton seed
which play crucial roles in the OIC production, consumption and trade are selected in order to
analyze the crop yields in this study.
Figure 18 shows the yield of wheat, which is one of themost common cultivated products in the
5
IDB, 2009
1,201
7,356
8,032
1,323
7,626
9,530
1,418
8,749
10,362
1,555
8,520
11,678
1,595
8,851
10,352
1,638
8,838
9,847
0
2000
4000
6000
8000
10000
12000
14000
African Group
Arab Group
Asian Group
Dollar/Worker
2000 2005 2010 2015 2016 2017