


 27 / 107

16
COMCEC Agriculture Outlook 2019
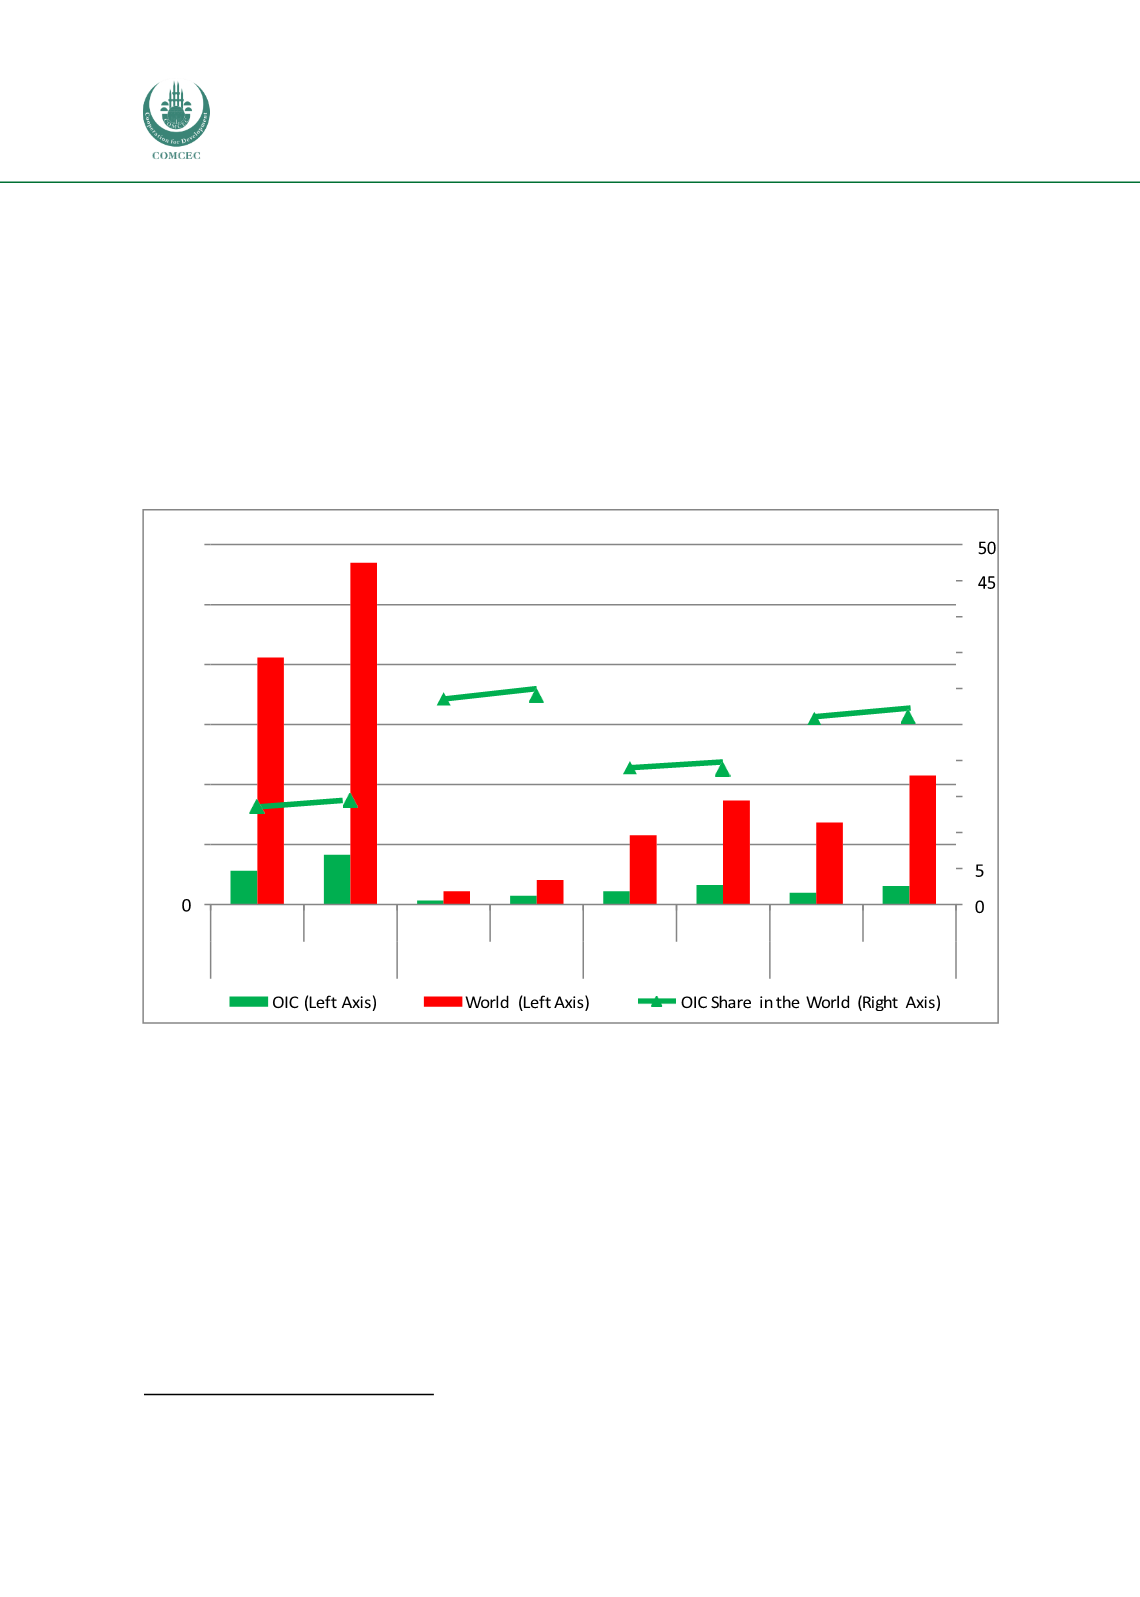
Figure 11 shows that in terms of the volume of agriculture production, as of 2017, OICmember
countries contributed 435 million tons to the world cereal production, representing 14.6
percent of the world total cereals production. Even though the cereal production increased by
44,7 percent in the period of 2000-2017, the share of OIC member countries in the world
cereal production showed a very slight increase. As of 2014, 70 million tons of oil crops were
produced in the OIC, compared to 31million tons in 2000. This substantial amount of oil crops
production in the OIC also stimulated the share of OIC member countries in theworld oil crops
production, which increased from 28.6 percent to 34.4 percent during the 2000-2014 period.
Among the commodity groups in the OIC, oil crops have the highest share in theworld with an
increasing trend.
Figure 11 Crop Productions in the OIC and Shares in the World
Source: FAOSTAT
In 2017, the share of OIC member countries in the world fruit production amounted to 19.05
percent, compared to19 percent in 2000. The share of OICmember countries in the world total
production of vegetables were around 14 percent in 2000 to 2017 period.
Figure 12 illustrates the developments in meat production in the OICmember countries and its
share in the world. In 2017, 9.8 million tons of beef and buffalo meat was produced in the OIC
as compared to 5.8 million tons in 2000. This noteworthy increase in beef and buffalo meat
production was mainly due to supply-side factors, such as cheap inputs, technological change
and scale efficiency gains in the last decade.
4
The significant increase in beef and buffalo meat
production also lead to an increase in the share of OIC member countries in the world’s
production, from 9.89 percent in 2000 to 14 percent in 2017.
4
SESRIC, 2015
Million Tons
3.000
2,980
%
2.500
2,059
34.4
2.000
28.6
40
35
30
1.500
19.0
19.05
1.000
13.6
14.6
866
576
13.8
13.98
25
20
15
500
435
10
279
31 110
204
70
109
165
94
152
2000
2017
2000
2014
2000
2017
2000
2017
Cereal
Oilcrops
Fruit
Vegetable
682
1,094