


 38 / 107

27
COMCEC Agriculture Outlook 2019
In addition to current water potential, the other important water resource is precipitation.
Precipitation provides soil withmoisture that is a crucial factor for productivity in agriculture.
Looking at precipitation in OIC member countries, it is understood that most of them have
average precipitation less than 500mmper year implying high prevalence of aridity. Especially,
most of the 20 countries in the Arab Group have less than 500mmprecipitation level except for
Comoros and Lebanon. On the other hand, 19 countries possess more than 1,000 mm average
long-termprecipitation annually. Of these countries, Malaysia, Brunei, Indonesia, Bangladesh,
Sierra Leone, Guyana and Suriname receive over 2,000 mm.
When discussing irrigation, it is not sufficient to know only the water potential. Additionally, we
need to look at the utilization of this potential in agriculture. Large part of the OIC member
countries are located in arid and semi-arid regions geographically. Hence, widespread and
modern irrigation systems, includingwater storage facilities are required.
In the OIC member countries as a whole traditional ways of irrigation are widely used.
Therefore, the efficient use of water in agriculture is not adequately addressed by most of the
countries of the regionwhere sustainability of the existing irrigation systems are at stake. While
surface irrigation is by far themost widely used system in irrigation (practiced on 82.1 percent
of the total full and partial controlled irrigation area), the most water -saving system through
micro-irrigation techniques is only practiced on a mere 1.7 percent of the total irrigation area.
10
2.5
Fertilizer
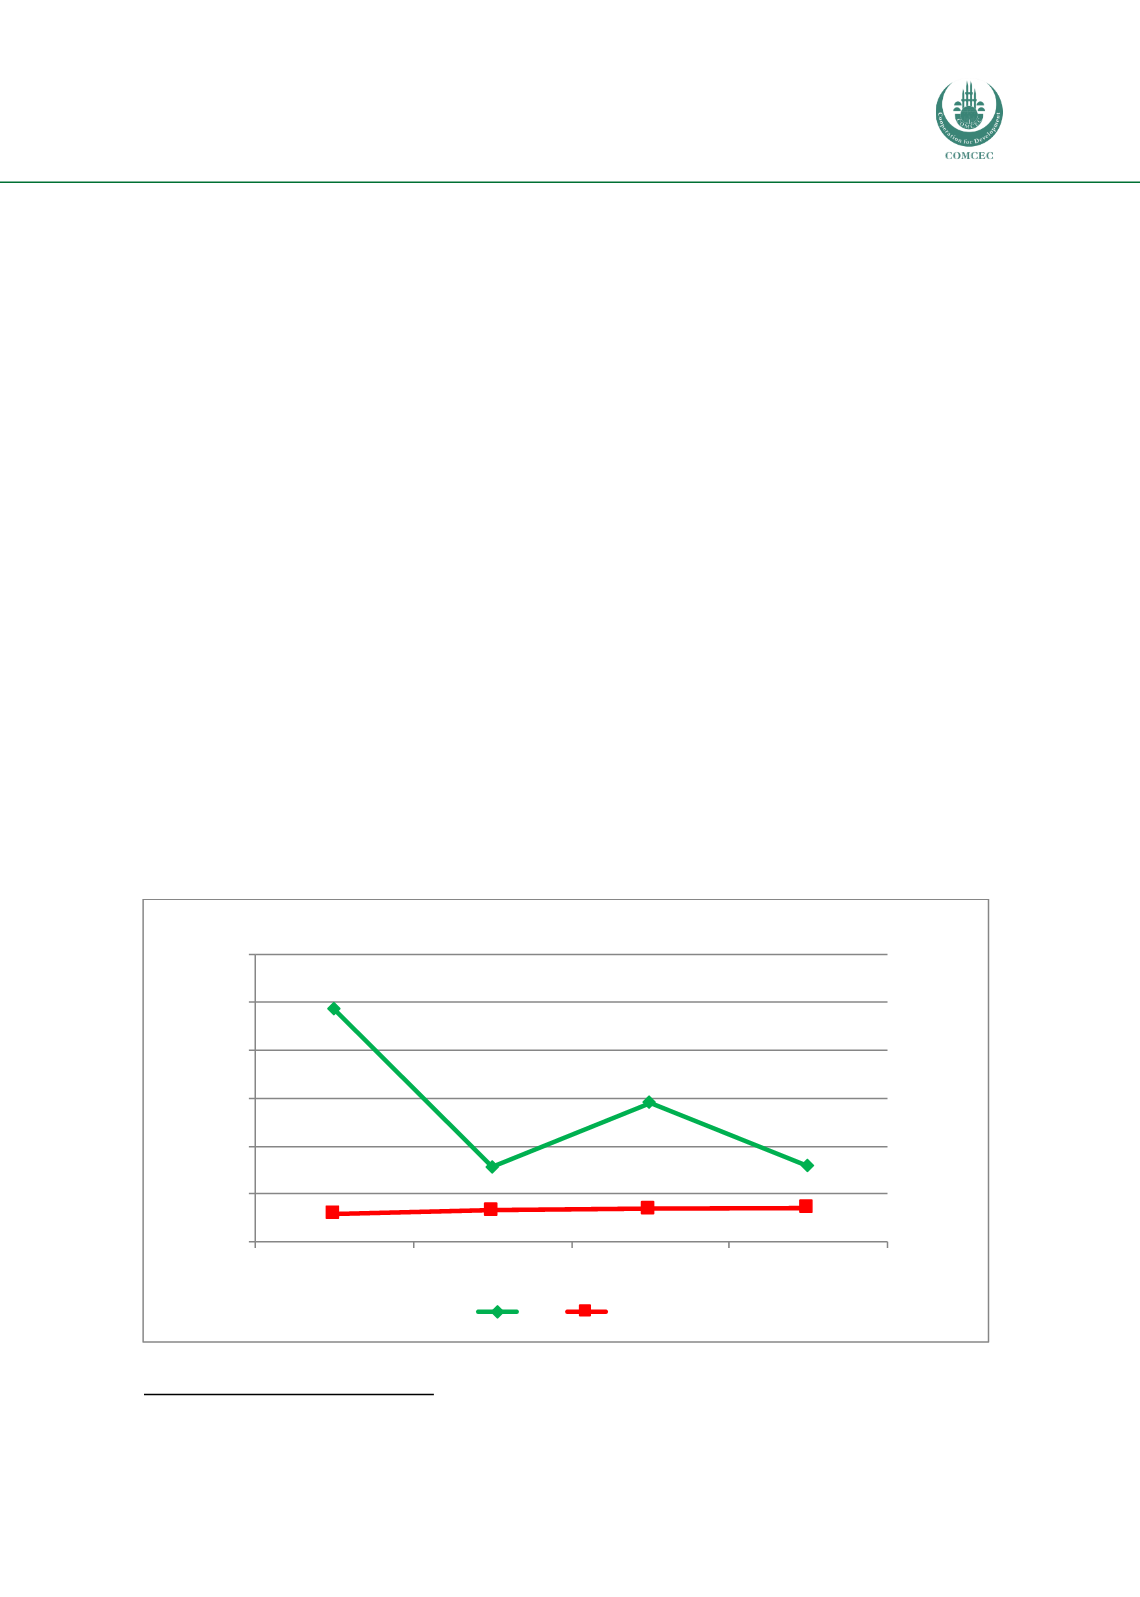
The average use of fertilizer per hectare in the OIC member countries dropped from 581.5
kilograms in 2016 to 315.5 kilograms in 2017. As of 2017, the world average fertilizer use
reached 140.6 kilograms, which is around 45 percent of the OIC average.
Figure 23 Fertilizer Use in the OIC and World
Source: FAOSTAT
10
SESRIC, 2014
970.9
313.1
581.5
315.5
115.8
131.0
138.0
140.6
0.0
200.0
400.0
600.0
800.0
1000.0
1200.0
2010
2015
2016
2017
kg/ha
OIC
World