


 36 / 107

25
COMCEC Agriculture Outlook 2019
According to FAOdata, total renewable water resources in theworld have been declining, and it
is calculated as 54,705 km
3
/year for the period 2013-2017. The continental distribution of total
renewable water resources can be seen in Figure 21. America has 25,203 km
3
/year total
renewable water resources constituting 46.1 percent of the world. Following to America, Asia
and Europe comprise 15,242 km
3
/year and 7,736 km
3
/year total renewable water resources,
respectively. Figure 21 also shows another meaningful indicator which is called renewable
water resources per hectare of agricultural land. It provides adequacy rate of total renewable
water resources with respect to agricultural land of a region. With respect to this indicator,
America, which possesses one fourth of the world’s total agricultural area, has still the most
renewable water resources per hectare of agricultural land with 20,580 m
3
/ha. It can be
explained by its rich water potential. Following to America, Europe, having 9.5 percent of the
world’s total agricultural area, has 16,531m
3
/ha renewablewater for per hectare agricultural
land. Lastly, Africa and Asia, covering most of the OIC member countries, have very low level
renewable fresh water for per hectares compared to America, Europe and the average of the
world.
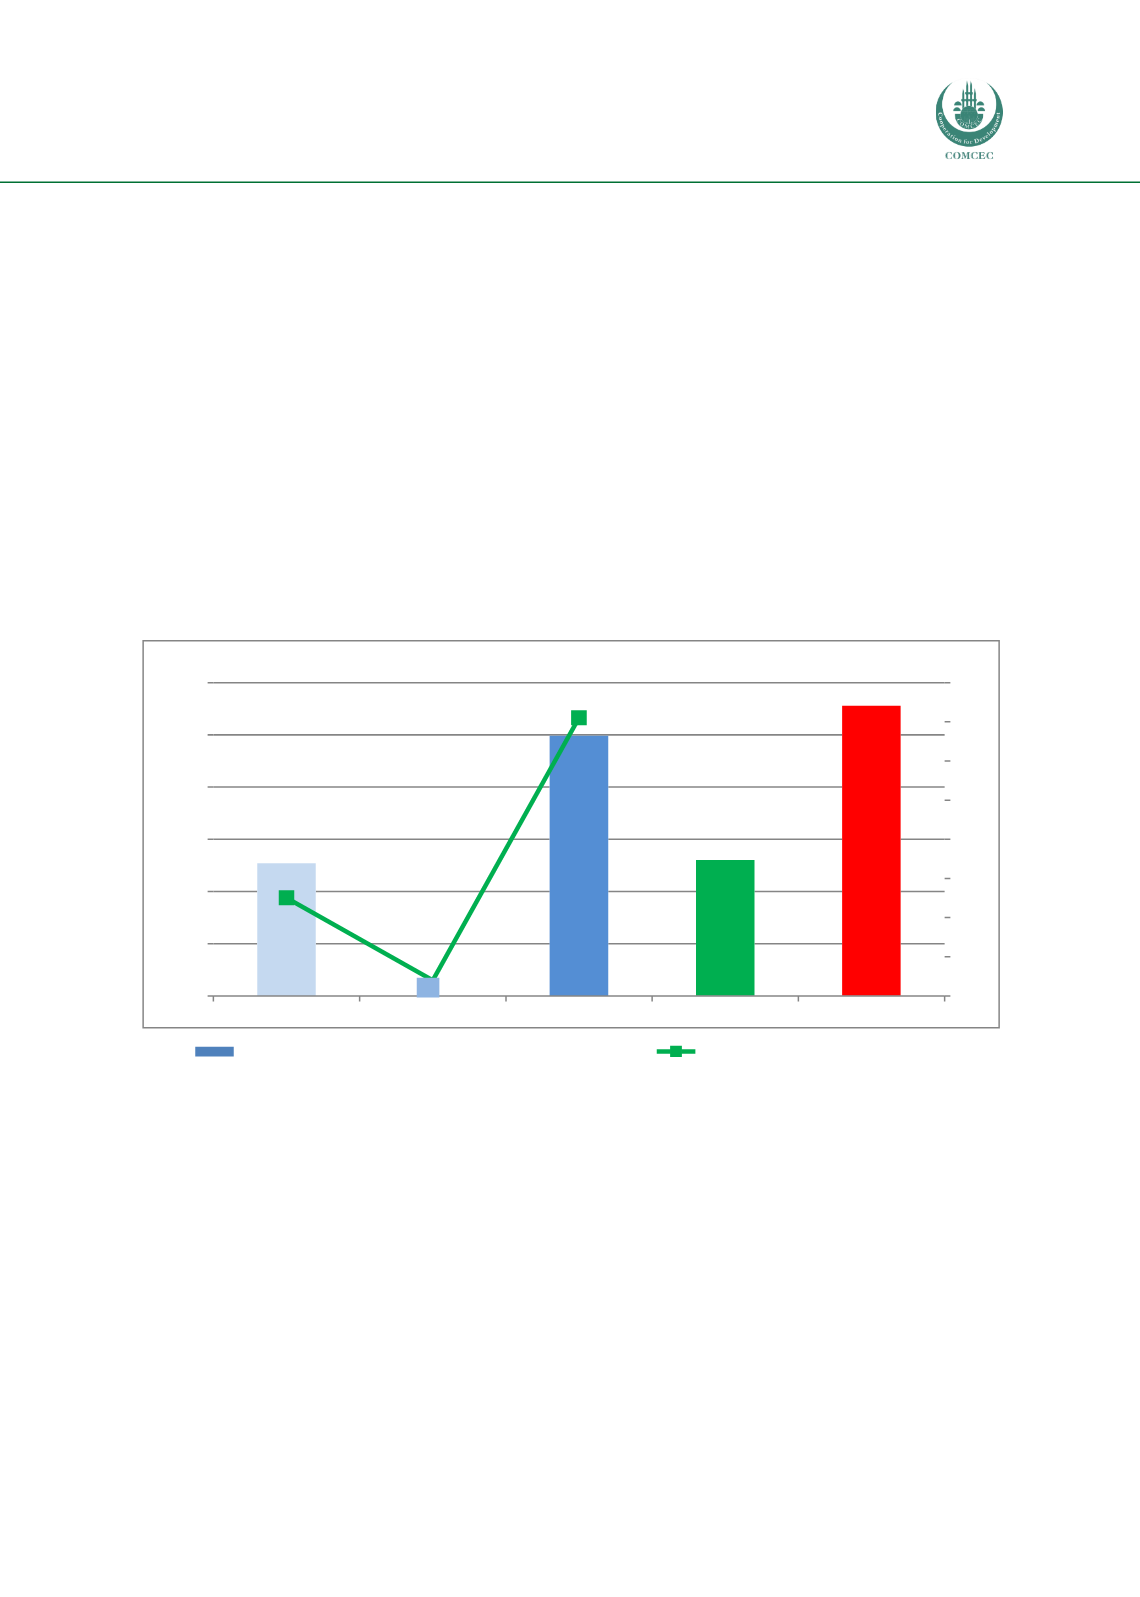
Figure 22 Renewable Water Potential in the OIC by Sub-Regions
Source: Calculated by using AQUASTAT and FAOSTAT
OICmember countries have 7,261 km
3
/year of renewable water resources for the period 2013-
2017 that accounts for 13.3 percent of the world’s total. Taking into account the fact that OIC
member countries have 28 percent of world’s total agricultural area, we can say that, the
majority of theMember Countries face water scarcity. This observation can be clearly seen from
Figure 22. Average renewable water resources per hectare of agricultural land in the OIC is
5,199m3/ha, which is lower than half of theWorld’s average.
At the sub-regional level, renewablewater resources disperse unequally in the OIC. Moreover,
the share of renewable water resources to the agricultural land varies considerably among its
sub-regions. While Asian Group has 71 percent of the renewablewater resources in the OIC, it
possesses 9,965m
3
/ha renewablewater per hectare of agricultural land, Arab Group ownes 4
percent of renewable water resources with 554 m
3
/ha renewable water per hectare of
agricultural land.
m
3
/ha
%
12.000
80
% 71
11,114
10.000
70
9,965
60
8.000
50
6.000
5,199
40
4.000
5,079
% 25
30
20
2.000
% 4
10
0
554
Arab Group
0
African Group
AsianGroup
OICAverage
World
RenewableWater Resources Per Hectare (left axis)
Share of RWR in the OIC (right axis)