


 29 / 107

18
COMCEC Agriculture Outlook 2019
Million Tons
120
%
106
45
100
94.76
40
80
35
30
60
19.7
25
18.6
41.72
20
40
13
15
20
5.6
20.91
17.48
10
12.29
2.35
2000
2015
2000
2015
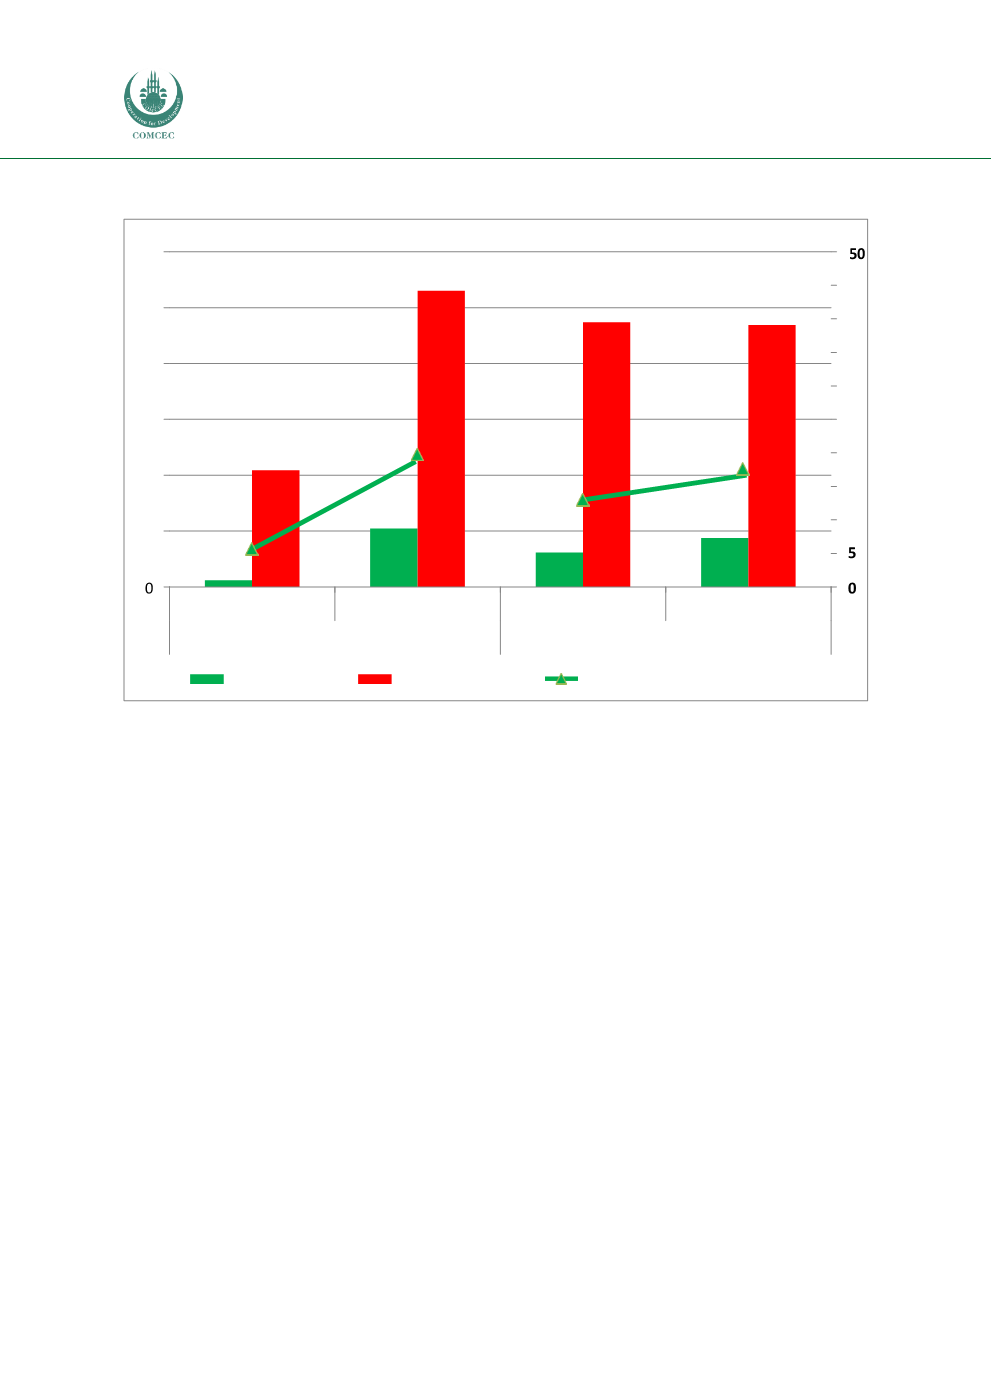
Non-Capture fisheries production
Capture fisheries production
OIC (Left Axis)
World (Left Axis)
OIC Share in the World (Right Axis)
Figure 13 Fishery Productions in the OIC and Shares in the World
Source: FAOSTAT
2.3 Agricultural Productivity
Agricultural productivity is a broad concept which does not lend itself to a singlemeasurement.
In general terms, it is defined as the ratioof agricultural outputs toagricultural inputs. There are
a wide variety of productivity measures depending on the degree and type of aggregation of
outputs and inputs: single output and a single input (wheat production/wheat area), aggregate
output and single input (value of crop outputs/total crop area), single output and aggregate
inputs (wheat production/value of inputs), aggregate output and aggregate inputs (value of crop
production/ value of inputs used in crop production). Furthermore, aggregations can be done
using prices as weights but also using other indexing methodologies.
Since land and labor are themost important inputswhich are used throughout the production
process, below we present two aggregate productives to denote sector input use efficiency,
namely, productivities of land and labour measured as the ratios of total agricultural value
added to total agricultural arable land and agricultural labor respectively
Furthermore, at the product and farmlevel, crop yields are othercommonly usedmeasurements
of agricultural productivity. They are measured by the ratio of crop output to cultivated area.
Crop yields for several agricultural products important for the OIC, namely wheat, cotton and
maize are also presented.