


 30 / 107

19
COMCEC Agriculture Outlook 2019
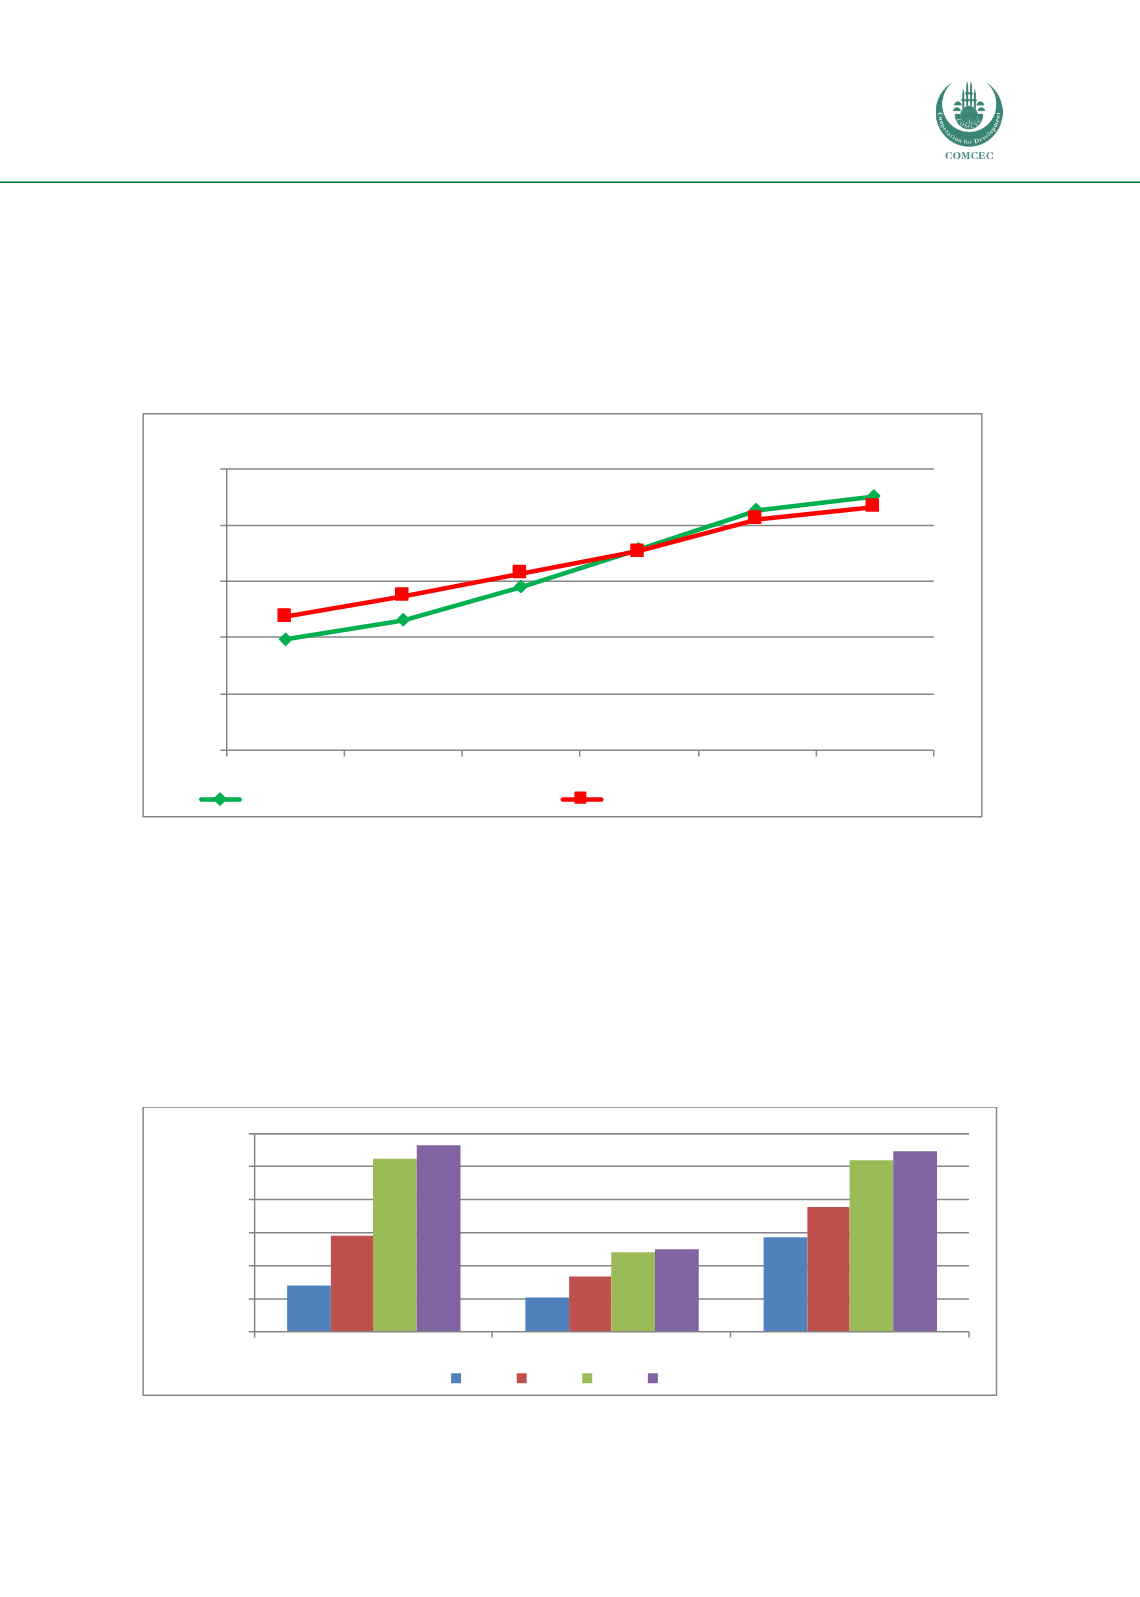
2.3.1 Land Productivity
Agricultural land productivity is measured by the ratio of total agricultural value added to the
arable area in a country. Therefore, it shows the agricultural value added per hectare of arable
land. Figure 14 illustrates agricultural land productivity in the OIC and in theWorld during the
period 1995-2017 using the real agricultural GDP at 2010 prices.
Figure 14 Land Productivity in the OIC and World (Agr. GDP at 2010 constant prices)
Source: Annex 28
In 2017, average agricultural land productivity of OIC member countries reached to 2,256 US
dollars/ha, from 986 US dollars/ha in 1995. Compared to the world, the rate of growth in
agricultural land productivity in OIC member countrieswas higher than theworld. During the
period 1995-2017, agricultural land productivity of OIC member countries increased by 129
percent, compared to only 82 percent in the world. The significant rates of growth in both OIC
and the World realized between the period 1995 and 2017, can be explained by dramatic
increases in real agricultural values added, while arable land areas remained almost the same.
Figure 15 Land Productivity in the OIC by Sub-Regions (Agr. GDP at 2010 constant prices)
Source: FAOSTAT
986
1159
1452
1788
2137
2256
1188
1373
1573
1770
2052
2162
0
500
1000
1500
2000
2500
1995
2000
2005
2010
2015
2017
Dollar/ha
OIC Average Agricultural Productivity
World Average Agricultural Productivity
702
529
1425
1448
846
1883
2615
1199
2609
2832
1240
2743
0
500
1000
1500
2000
2500
3000
African Group
Arab Group
Asian Group
Dollar/ha
1995 2005 2015 2017