
Financial Outlook of the OIC Member Countries 2017
10
an
d liquidity.Quantitative easing has been implemented a lot in recent times. Following the
global financial crisis of 2007-08, the U.S. central bank, the Federal Reserve, implemented
several rounds of quantitative easing. More recently, the Bank of Japan and the European
Central Bank have implemented quantitative easing (Investopedia).
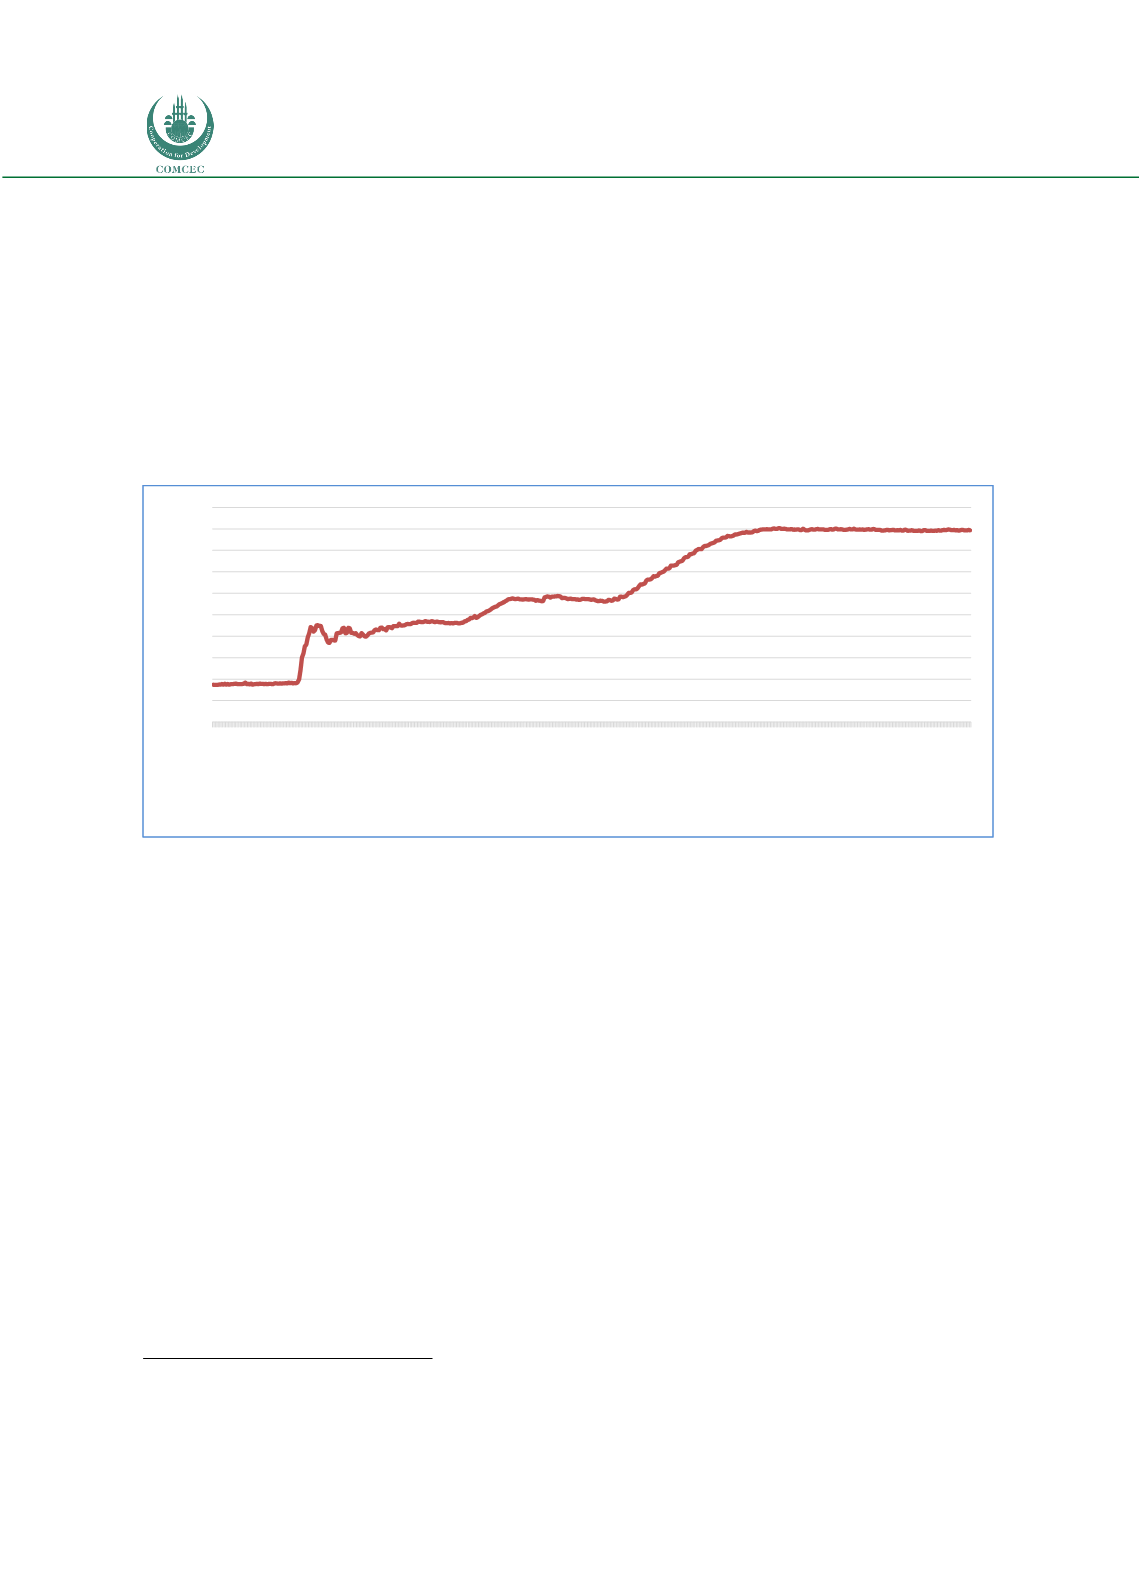
In response to extreme disturbances in the credit market in the fall of 2008, the Federal
Reserve lowered the policy rate target close to zero, announced unprecedented interventions
in the bond market, and offered forward guidance to the markets. From November 2008 to
2013 the Fed announced three rounds of asset purchases, totaling over $3 trillion, to address
poor economic activity.
17
Figure 11: FED Total Assets (Billion US$)
Source: Federal Reserve
(https://www.federalreserve.gov/monetarypolicy/bst_recenttrends_accessible.htm)
Global financing conditions have been benign since the start of 2017. After November 2016,
U.S. long-term yields rose sharply, similar to their surge during the mid-2013 Taper Tantrum.
Unlike the Taper Tantrum, the late-2016 increase reflected market expectations of
strengthening growth and higher inflation in the United States, and was not accompanied by a
sudden and sustained re-pricing of risk, including of emerging market assets. Since early 2017,
U.S. long-term yields have plateaued, even as the Federal Reserve has continued to raise short-
term rates.
18
The policy actions related to the quantitative easing of the major central banks have had
substantial spillover effects on the financial markets of the emerging-market economies. As
interest rates in developed economies remained low, investors were attracted to the higher
rates in many emerging economies and this has been reversed during the normalization of the
monetary policy in the US recently with the surge of the interest rates. As a result, these
policies have significant effects on exchange rates, capital flows, interest rates and asset prices
in the emerging market economies. The following figure just depicts the fluctuations of
exchange rates of some emerging market economies against US dollar during this period.
17
Agostini, G., Garcia, J. , “Comparative Study of Central Bank Quantitative Easing Programs”, SIPA Columbia University, April
2016.
18
World Bank Global Economic Prospects, June 2017
0
500
1000
1500
2000
2500
3000
3500
4000
4500
5000
1-Aug-2007
7-Nov-2007
13-Feb-2008
21.May.08
27-Aug-2008
3-Dec-2008
11.Mar.09
17-Jun-2009
23-Sep-2009
30-Dec-2009
7-Apr-2010
14-Jul-2010
20-Oct-2010
26-Jan-2011
04.May.11
10-Aug-2011
16-Nov-2011
22-Feb-2012
30.May.12
5-Sep-2012
12-Dec-2012
20.Mar.13
26-Jun-2013
2-Oct-2013
8-Jan-2014
16-Apr-2014
23-Jul-2014
29-Oct-2014
4-Feb-2015
13.May.15
19-Aug-2015
25-Nov-2015
02.Mar.16
8-Jun-2016
14-Sep-2016
21-Dec-2016
29.Mar.17
5-Jul-2017


