


 21 / 94

Financial Outlook of the OIC Member Countries 2017
9
and reached its historically highest level of $2.4 trillion in 2012. This trend did not continue
and total exports fell slightly to $2.3 trillion dollars over the years of 2013 and 2014. However,
mainly because of the sharp drop in oil prices in 2015 as well as the fragility in the global
markets, export decreased by 29 percent and dropped to $1.6 trillion. The year 2016
witnessed further decline for exports from the OIC countries by 8.5 percent and realized as
$1.49 trillion.
As a result, the share of OIC countries in total exports of developing countries plunged to
24.3% in the same year, compared to 30.5% in 2012, and continued to remain below its pre-
crisis level of 32.6% observed in 2008. OIC countries’ collective share in total world
merchandise exports also followed a similar trend between 2012 and 2015, and decreased to
9.9 % in 2015, which is the lowest ratio observed since 2005.
15
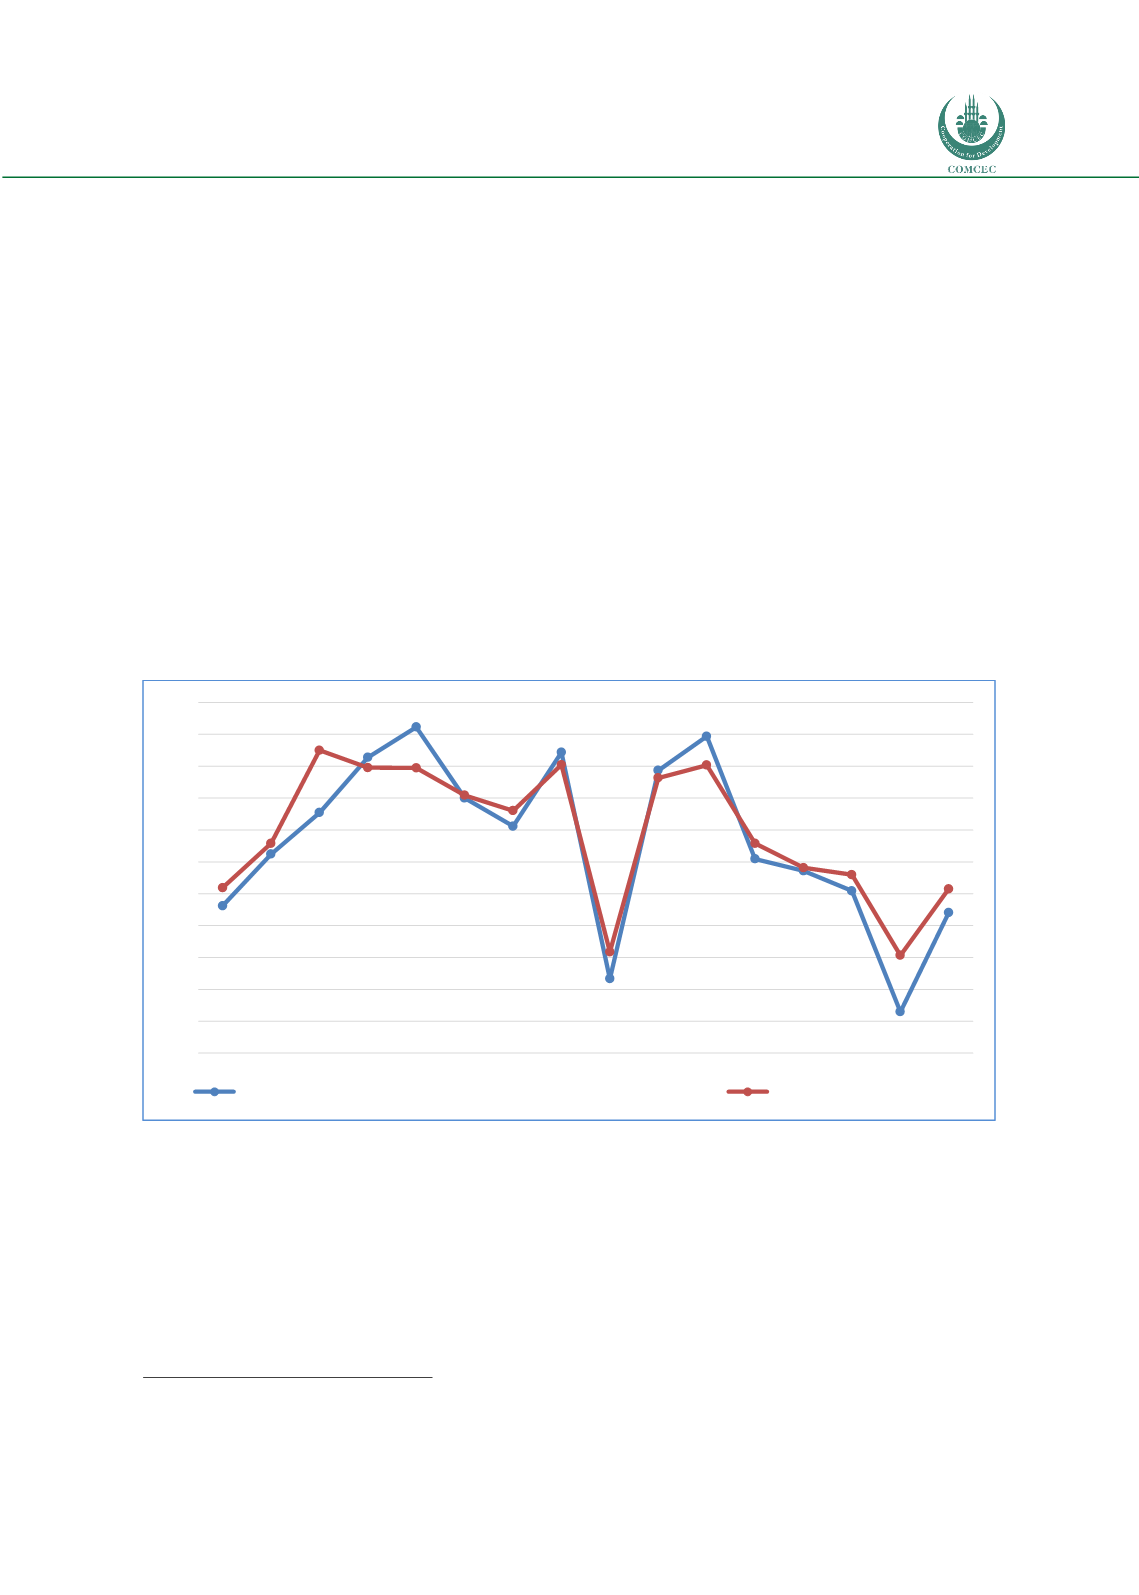
The fall in exports for the years of 2015 and 2016 can be partly explained by falling commodity
prices, where OIC countries have significant concentration. Moving forward, to achieve long-
term sustainable growth in merchandise trade and higher share in total world exports, OIC
countries will apparently need more competitive economic sectors with significant
diversification levels and higher technological intensity.
16
Figure 10: OIC Exports and Oil Prices
Source: Authors’ Calculations from IMF WEO and UNCTAD Stat
One of the main financial developments after the Global Financial crisis affecting whole
financial markets is an unconventional monetary policy practice implemented by the major
developed economies called quantitative easing.
Quantitative
easing
is
an
unconventiona
l monetary policyin
which
a central bankpurchase
s government securities or other securities from the market in order to lower
interest rates and increase the money supply. Quantitative easing increases th
e money supplyby flooding financial institutions with capital in an effort to promote increased lending
15
2016 OIC Economic Outlook, SESRIC
16
2016 OIC Economic Outlook, SESRIC
-60
-50
-40
-30
-20
-10
0
10
20
30
40
50
2001
2002
2003
2004
2005
2006
2007
2008
2009
2010
2011
2012
2013
2014
2015
2016
Crude Oil (petroleum), Dated Brent,US$ per barrel (% Change)
OIC Export (% Change)