


 23 / 94

Financial Outlook of the OIC Member Countries 2017
11
Over the four-year period between mid-2009 and 2013Q1, cumulative gross financial inflows
into the developing world increased from $192 billion to $598 billion. This is more than twice
the rate of the four-year period ending in 2006Q1, and capital flows into emerging markets
more than doubled as a percent of GDP.
19
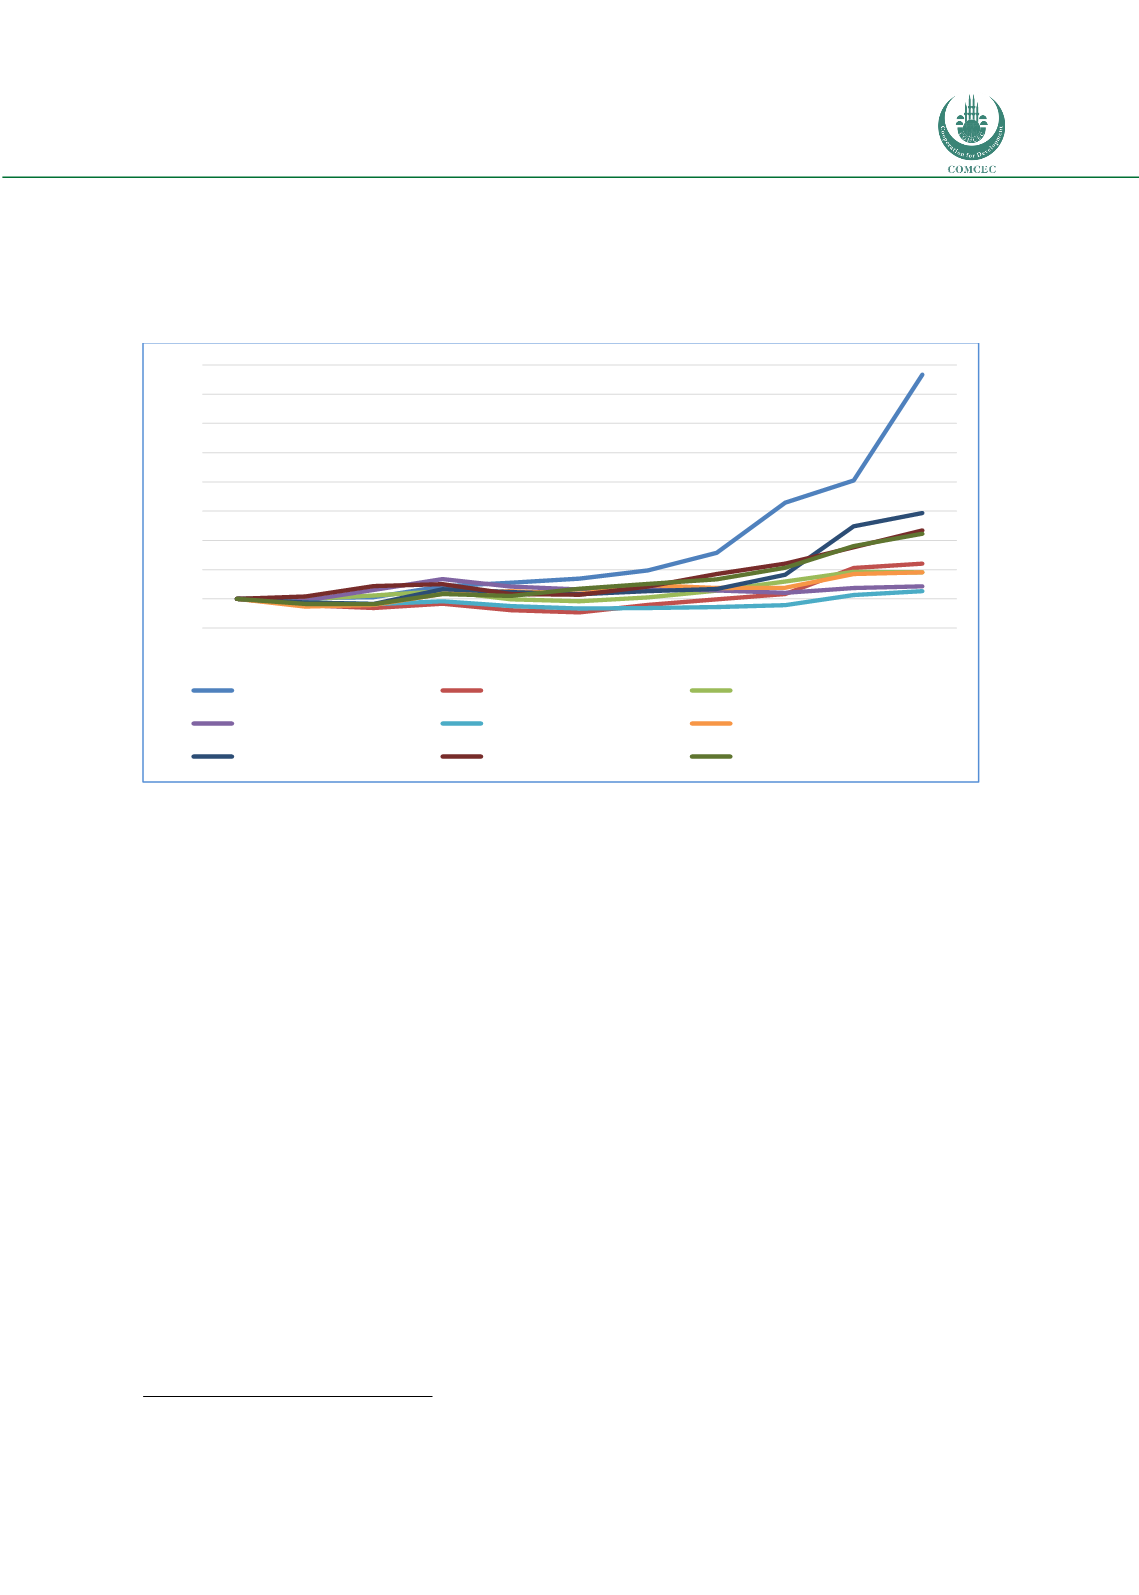
Figure 12: Exchange Rates of the Selected Economies per US$ (2006=100)
Source: Authors’ calculation from the UNCTAD Stat
The figure above shows the exchange rates of selected countries per US$ over the years
between 2006 and 2016. As the normalization of the monetary policy in the US, the previously
over valued exchange rates of emerging and developing economies started to depreciate
against US dollar.
19
Chari, A. “Taper Tantrums: QE, its Aftermath and Emerging Market Capital Flows”, November 2016
50
100
150
200
250
300
350
400
450
500
2006 2007 2008 2009 2010 2011 2012 2013 2014 2015 2016
Argentina (ARS)
Brazil (BRL)
Indonesia (IDR)
Korea, Republic of (KRW)
Malaysia (MYR)
Romania (RON)
Russian Federation (RUB)
South Africa (ZAR)
Turkey (TRY)