


 20 / 94

Financial Outlook of the OIC Member Countries 2017
8
goods trade is supporting an upturn in China’s exports, which in turn boosts imports of
intermediate products across regional and global value chains.
13
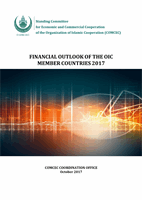
Figure 8: World Trade Volume of Goods and Services (% Change)
Source: IMF WEO Database, April 2017
After 2.2 percent increase in 2016 which was the lowest level since the Global financial crisis,
the World trade growth is expected to rebound to 4 percent in 2017. The recovery in trade
growth in 2017 is supported by stronger import demand from major advanced economies,
increased trade flows to and from China, and a diminished drag from weak import demand
from commodity exporting EMDEs.
14
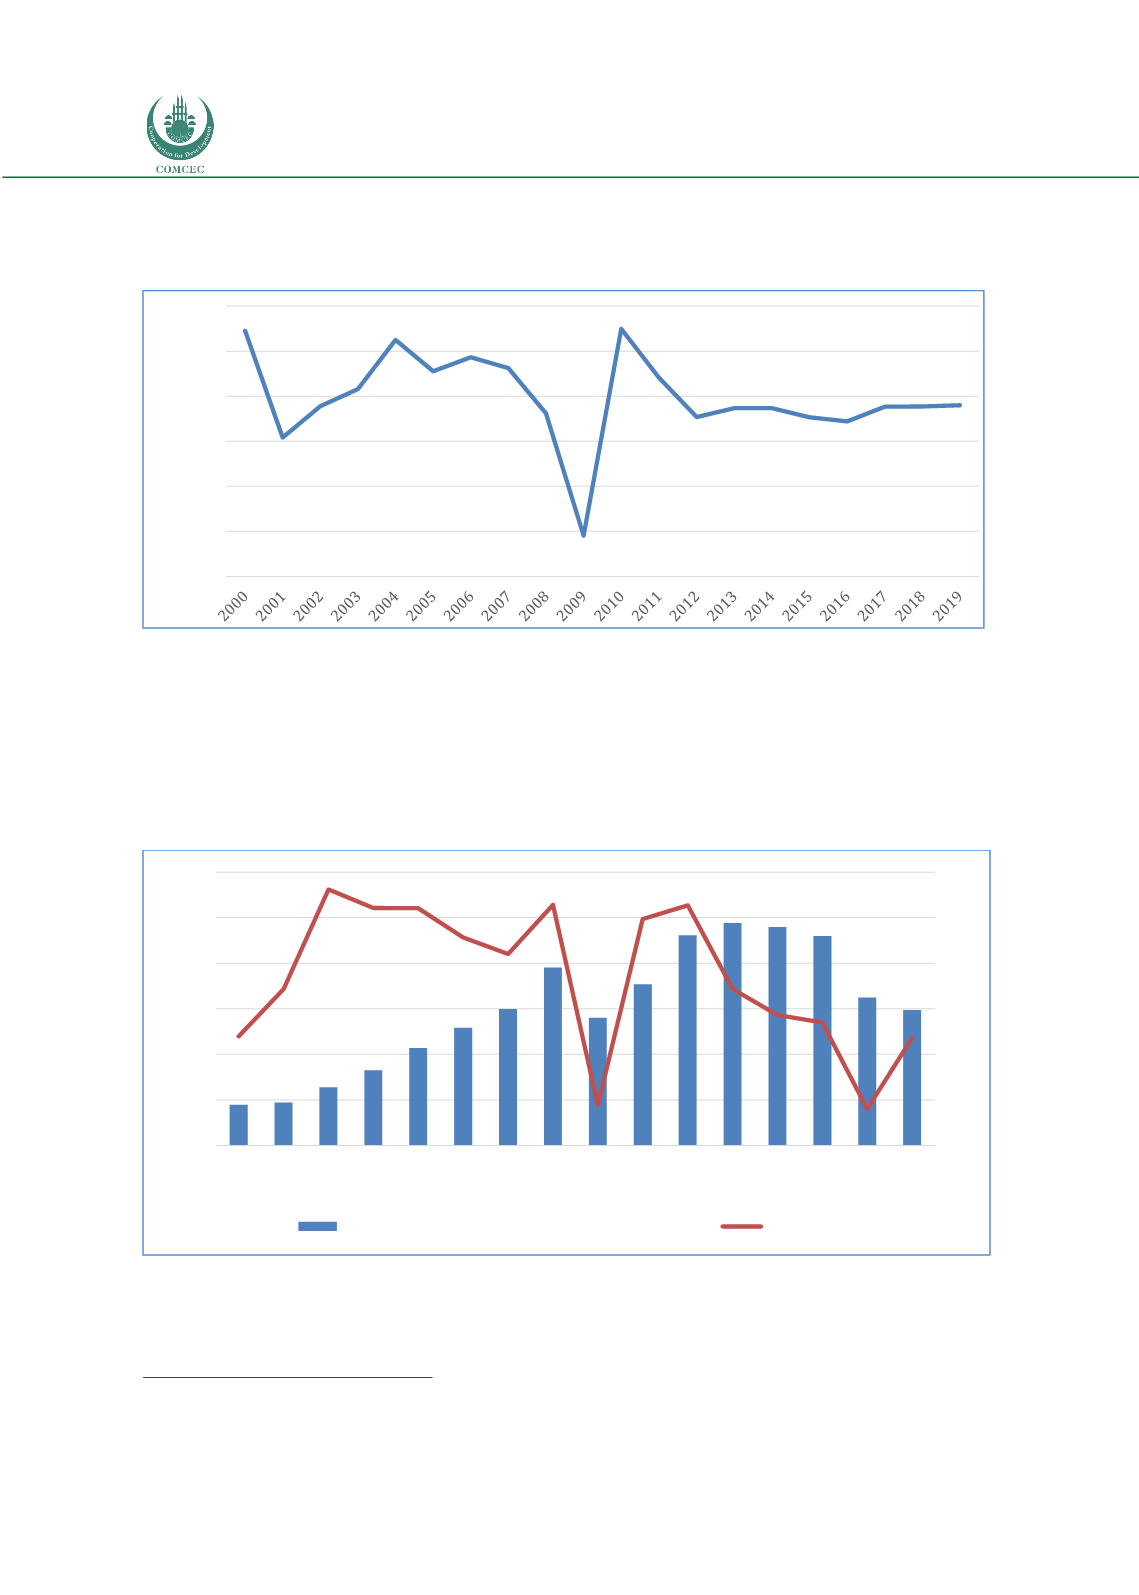
Figure 9: OIC Merchandise Export
Source: UNCTAD Stat
Following the global financial crisis in 2009, total merchandise exports from OIC countries fell
sharply around 28 percent compared to previous year, it started to pick up rapidly since then
13
World Bank Global Economic Prospects, June 2017
14
World Bank Global Economic Prospects, June 2017
-15
-10
-5
0
5
10
15
-40
-30
-20
-10
0
10
20
30
40
0
500
1.000
1.500
2.000
2.500
3.000
2001
2002
2003
2004
2005
2006
2007
2008
2009
2010
2011
2012
2013
2014
2015
2016
OIC Total Merchandise Exports (Billion US$)
% Change