


 17 / 94

Financial Outlook of the OIC Member Countries 2017
5
Most of the total OIC GDP is produced by a few member countries. In 2015, the top 10 OIC
countries in terms of the volume of GDP produced 73.8% of the total OIC countries output.
Among these countries Indonesia has the highest share in OIC GDP (16.7%) followed by Saudi
Arabia (9.9%), Turkey (9.3%) and Iran (8.0%). For that reason, the overall economic
performance of the group of the OIC member countries remained highly dependent on the
developments in these ten countries
9
.
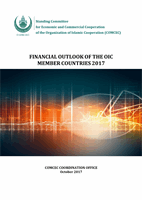
The figure below depicts the GDP growth rates of the selected country groups, namely all
EMDE (Emerging Markets and Developing Economies) countries and EMDE MNA (Middle East
and North Africa) Oil Exporters. The figure clearly shows how oil exporting countries have
differed negatively from the average of all EMDE countries over the selected period. After 2014
as the oil prices plummeted sharply the economic growth of all commodity exporters showed a
sluggish performance.
Figure 3: GDP Growth Rates for EMDE Countries (%)
Source: World Bank, Global Economic Prospects, constant 2010 US$.
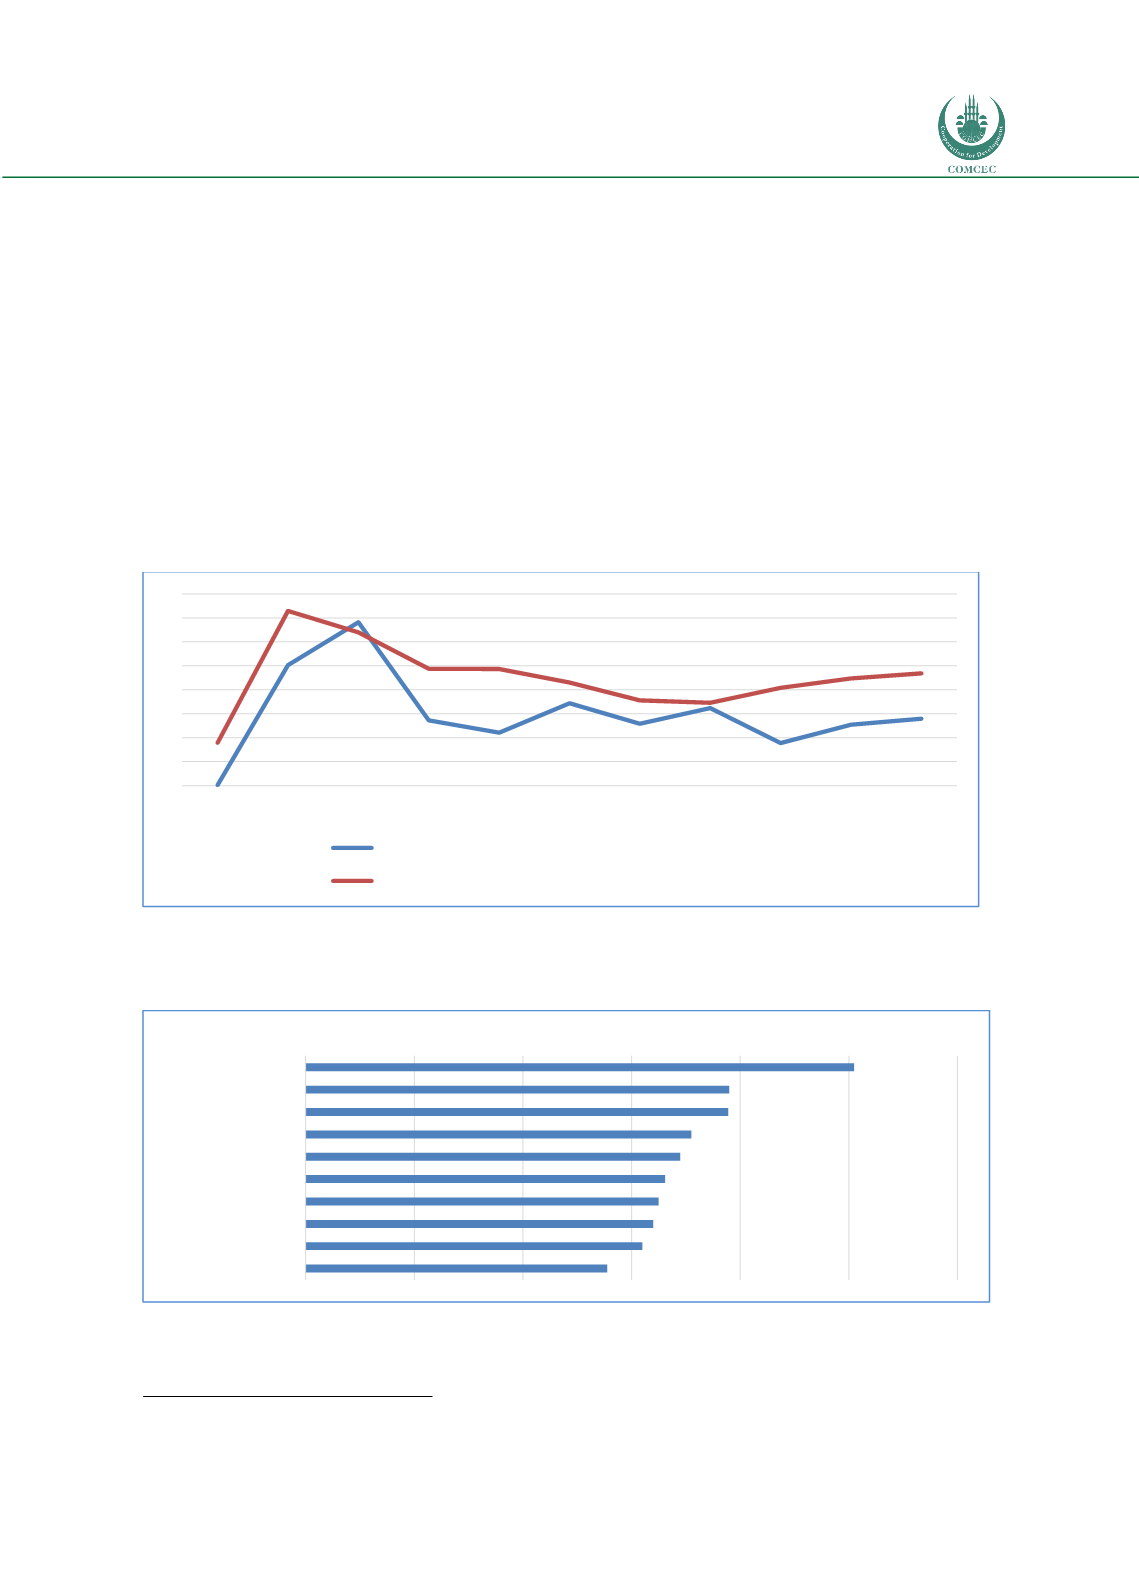
Figure 4: Top-10 OIC Countries in terms of GDP Growth-2016 (%)
Source: World Bank, Global Economic Prospects
9
2016 OIC Economic Outlook, SESRIC
0
1
2
3
4
5
6
7
8
2009 2010 2011 2012 2013 2014 2015 2016 2017 2018 2019
EMDE MNA (Middle East North Africa) Oil exporters
Emerging Markets and Developing Economies (EMDE)
0
2
4
6
8
10
12
Iraq
Uzbekistan
Cote d'Ivoire
Bangladesh
Tajikistan
Senegal
Djibouti
Iran, Islamic Rep.
Turkmenistan
Mali