


 16 / 94

Financial Outlook of the OIC Member Countries 2017
4
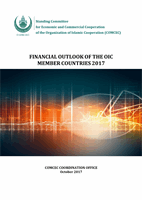
The growth performances of the OIC countries are expected to realize slightly lower than the
average of the EMDE during the same period. The OIC countries are projected to grow by 3.9
and 4.1 percent in 2017 and 2018 respectively after growing 3.2 percent in 2016.
Figure 1: Comparison of the GDP Growth Rates of Selected Country Groupings
Source: World Bank Global Economic Prospects, June 2017
Advanced economies started 2017 on a solid note, with investment and exports regaining
momentum after subdued growth in 2016. Private consumption decelerated in early 2017, but
has been supported by labor market improvements. Import demand has strengthened, further
contributing to a recovery in global trade. In 2017, growth is expected to pick up in the United
States and Japan, and to remain broadly stable in the Euro Area.
8
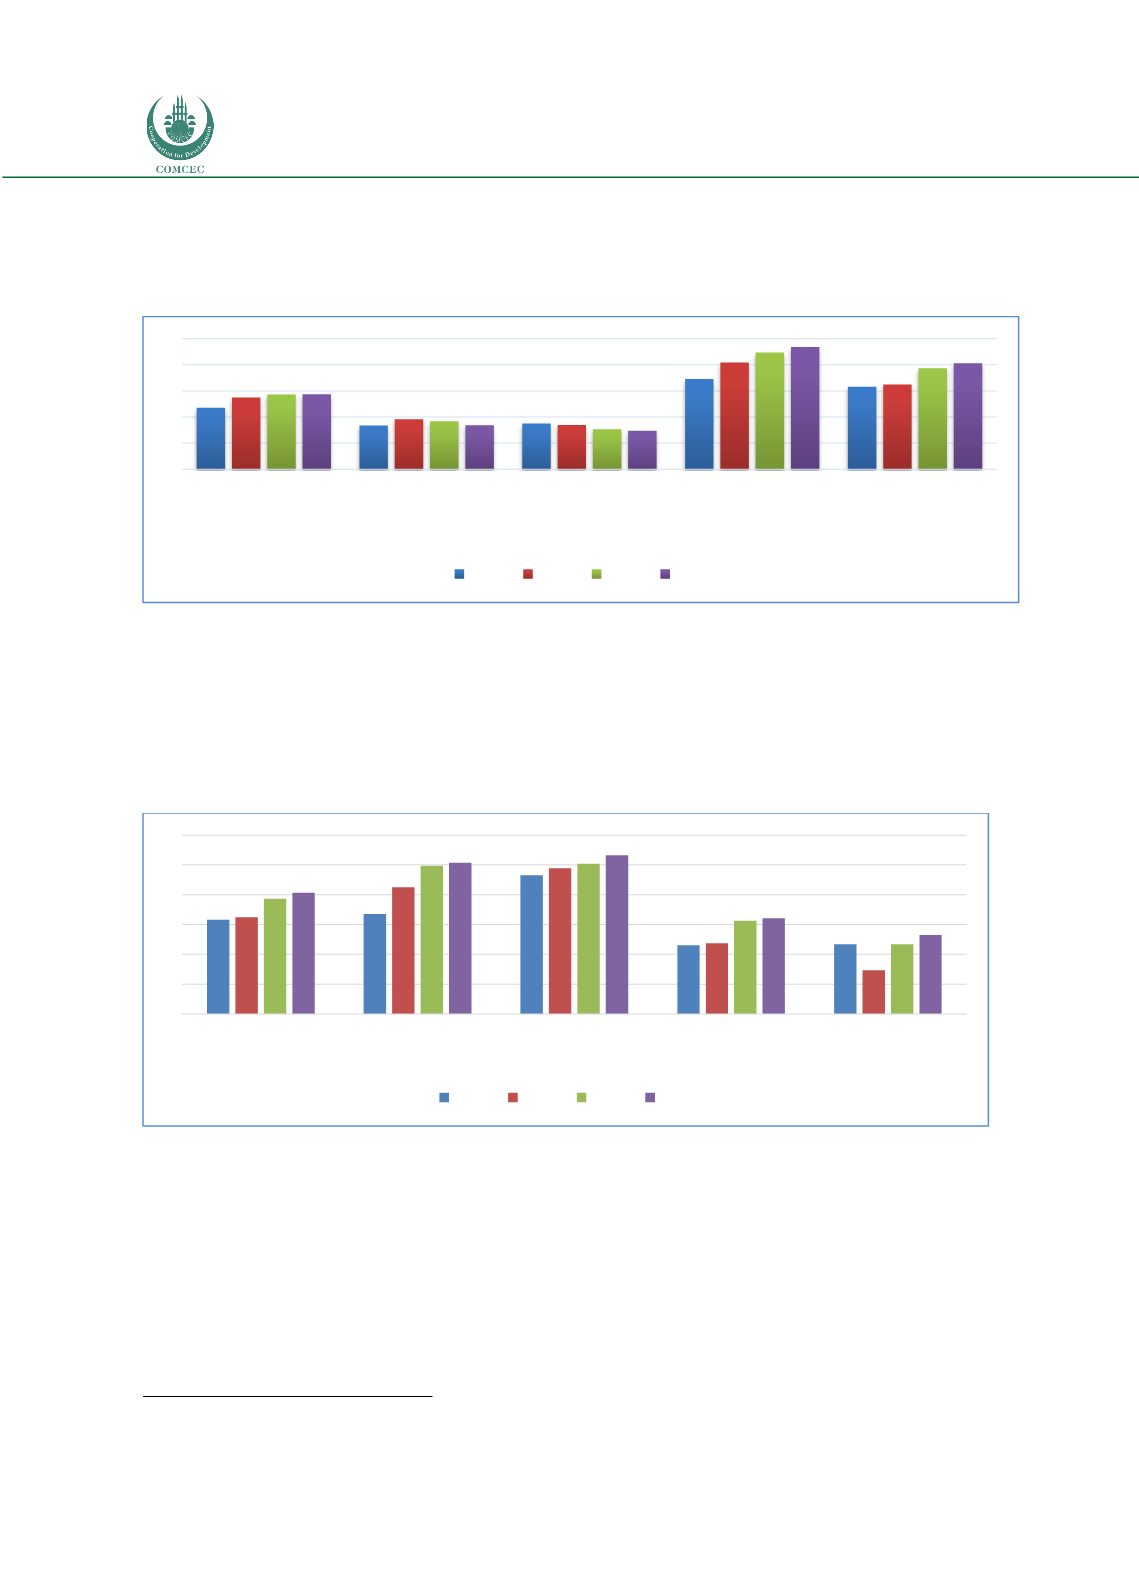
Figure 2: GDP Growth Rates for Selected OIC Country Groups (%)
Source: World Bank
The GDP growth rates of OIC countries has slowed down to 3.3% in 2015, as compared to 4.1%
in 2014, and expected to stay subdued around this level during 2016 and 2017 which is in line
with the global slowdown in economic activity. This is mainly related to the decline in oil
prices and macroeconomic distress for oil exporting countries like Saudi Arabia, Iran, Nigeria
and United Arab Emirates etc. However, the growth prospects for the OIC member countries
are expected to increase to 3.9 and 4.1 percent during 2018 and 2019 respectively.
8
World Bank Global Economic Prospects, June 2017
0
1
2
3
4
5
World
Advanced
Economies
Euro Area
Emerging Markets
and Developing
Economies
OIC
2016 2017 2018 2019
0
1
2
3
4
5
6
OIC
OIC-Low Income
Group
OIC-Lower Middle
Income Group
OIC-Upper Middle
Income Group
OIC-High Income
Group
2016 2017 2018 2019