
Malnutrition in the OIC Member
Countries: A Trap for Poverty
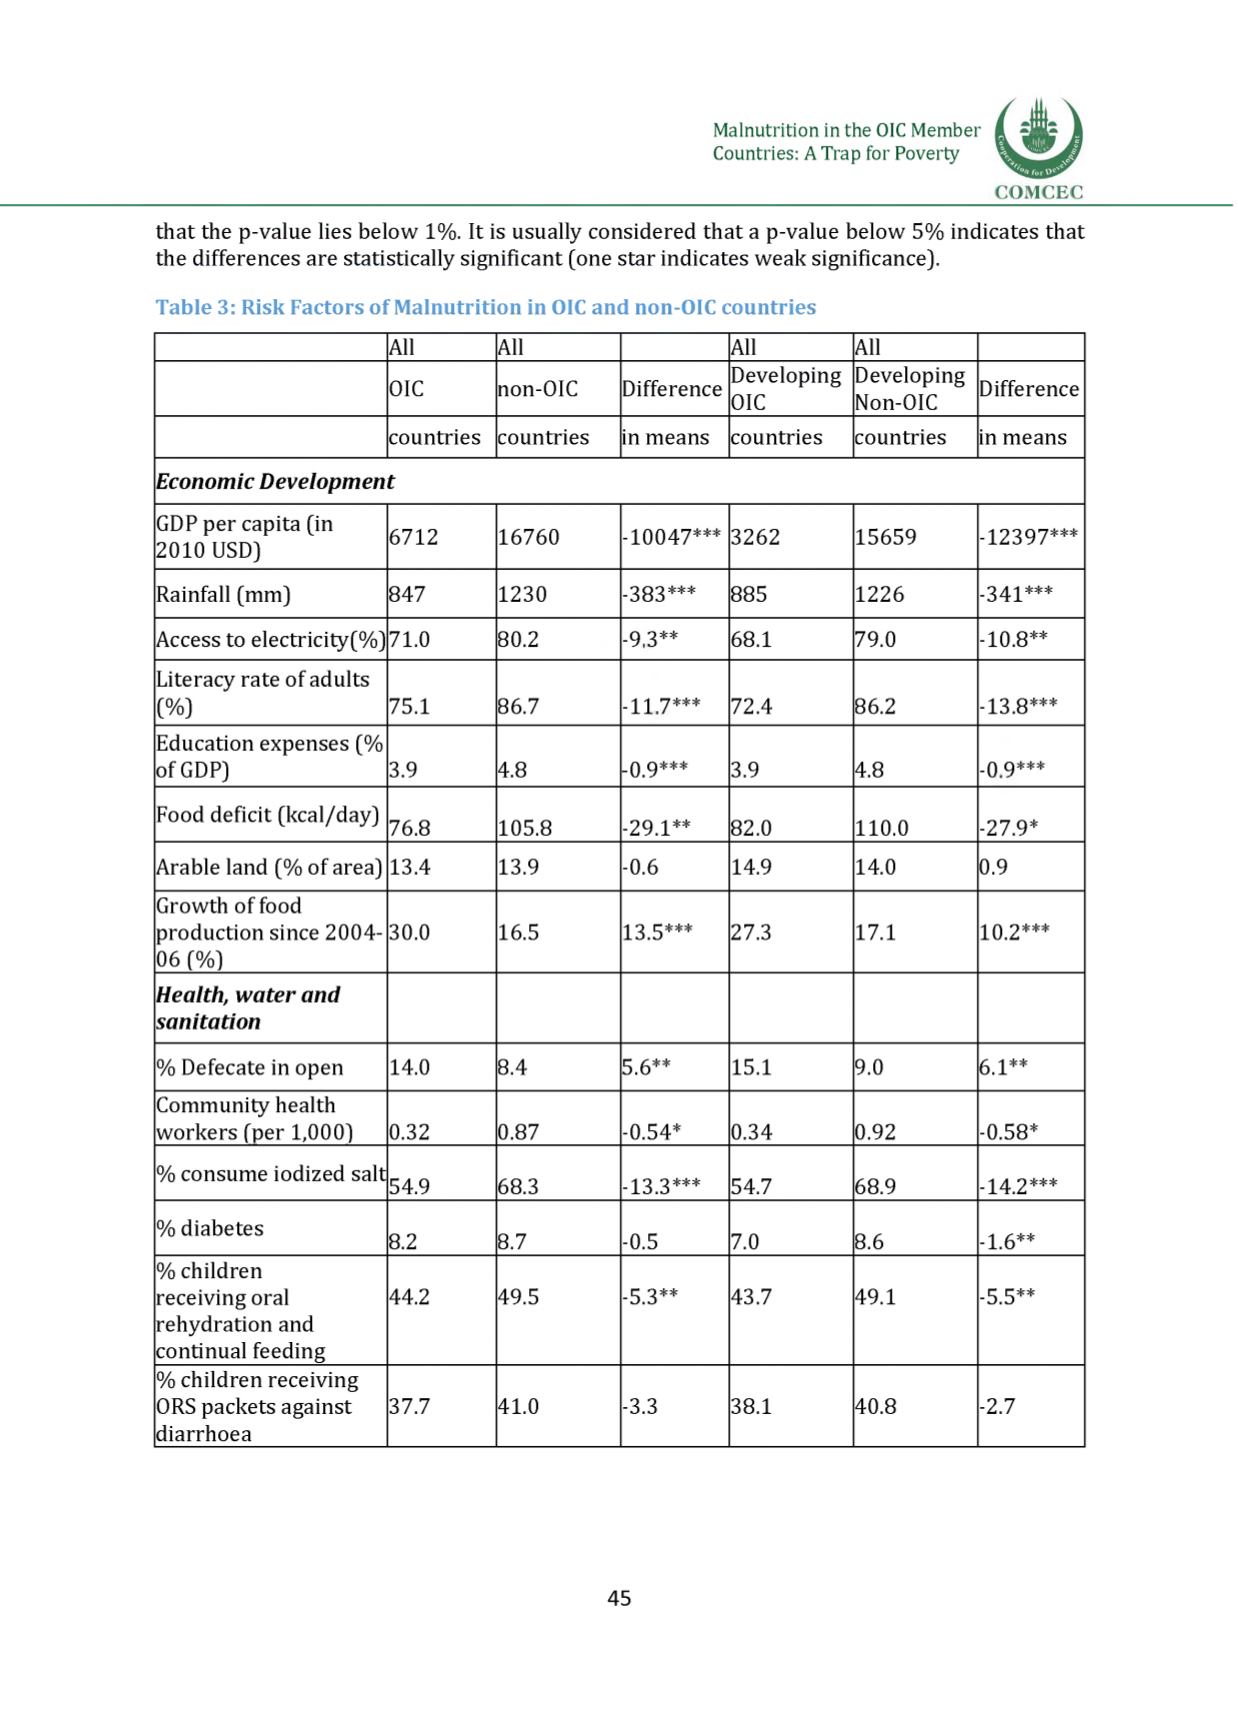
th a t th e p -v a lu e lies b e low 1% . It is u su ally c o n s id e re d th a t a p -v a lu e b e low 5 % in d ic a te s th a t
th e d iffe re n ce s a re sta tistica lly sig n ifica n t (o n e s ta r in d ic a te s w e a k sig n ifican ce).
Table 3: Risk Factors of Malnutrition in OICand non-OIC countries
All
All
All
All
OIC
non-O IC D ifferen ce
D ev elop ing
OIC
D evelop ing
Non-OIC
D ifferen ce
c o u n trie s co u n trie s in m e a n s c o u n trie s co u n trie s in m e a n s
Economic Development
GDP p e r ca p ita (in
2 0 1 0 USD)
6 7 1 2
1 6 7 6 0
- 1 0 0 4 7 * * * 3 2 6 2
1 5 6 5 9
- 1 2 3 9 7 * * *
R ain fall (m m )
8 4 7
1 2 3 0
-3 8 3 * * *
8 8 5
1 2 2 6
-3 4 1 * * *
A cce ss to e le c tric ity (% ) 7 1 .0
8 0 .2
-9
3
**
6 8 . 1
7 9 .0
-
1 0
.
8
**
L ite ra c y r a te o f ad u lts
(% )
7 5 .1
8 6 .7
- 1 1
7
*** 7 2 .4
8 6 . 2
-1 3 .8 * * *
E d u ca tio n e x p e n s e s (%
o f GDP)
3 .9
4 .8
-0 .9 * * *
3 .9
4 .8
- 0
9
***
F o o d d eficit (k c a l/d a y )
7 6 .8
1 0 5 .8
-2 9 .1 * *
8 2 .0
1 1 0 . 0
-2 7 .9 *
A rab le land (% o f a re a ) 1 3 .4
1 3 .9
-
0 . 6
1 4 .9
1 4 .0
0 .9
G row th o f food
p ro d u ctio n sin ce 2 0 0 4
0 6 (% )
3 0 .0
1 6 .5
1 3 .5 * * *
2 7 .3
1 7 .1
1 0
.
2
***
Health, water and
sanitation
% D efecate in op en 1 4 .0
8 .4
5 .6 * *
1 5 .1
9 .0
6
.
1
**
C om m u n ity h ealth
w o rk e rs (p e r
1
,
0 0 0
)
0 .3 2
0 .8 7
-0 .5 4 *
0 .3 4
0 .9 2
-0 .5 8 *
% co n sum e iod ized s a lt
5 4 .9
6 8 .3
-1 3 .3 * * * 5 4 .7
6 8 .9
- 1 4 .2 * * *
% d ia b e te s
8 . 2
8 .7
-0 .5
7 .0
8 . 6
-
1
.
6
**
% ch ild re n
re c e iv in g o ral
re h y d ra tio n and
co n tin u al feed in g
4 4 .2
4 9 .5
-5 .3 * *
4 3 .7
4 9 .1
-5 .5 * *
% ch ild re n re ce iv in g
ORS p a c k e ts a g a in s t
d ia rrh o e a
3 7 .7
4 1 .0
-3 .3
3 8 .1
4 0 .8
-2 .7
45


